Colorado Monthly meterology 1995- 1997
These is a group of R data sets for monthly min/max temperatures
and precipitation over the period 1895-1997. It is created from
the more extensive US data record described in
Observed monthly
precipitation, min and max temperatures for the coterminous US
1895-1997
Data domain:
A rectagular lon/lat region [-109.5,-101]x [36.5,41.5] larger
than the boundary of Colorado comprises approximately 400
stations. Although there are additional stations reported in
this domain, stations that only report preicipitation or only
report temperatures have been excluded. In addition stations that
have mismatches between locations and elevations from the two
meta data files have also been excluded. The net result is 367
stations that have colocated temperatures and precipitation.
Processing script:
The complete details of how the orignal tar files were
processed to obtain the R data sets is in
CO.process.R .
R data object
Grab the binary R data object
COmonthly.Met.rda
Note the older version of this data object is still posted as:
RData.COmonthly.met
In R:
attach("RData_USmonthly_met")
This workspace will contain the objects:
- CO.info A data frame with columns:
station id, elev, lon, lat, station name
- CO.elev elevation in meters
- CO.id alphanumeric station id codes
- CO.loc locations in lon/lat
- CO.ppt CO.tmax CO.tmin Monthly means as three dimensional arrays
( Year, Month, Station). Temperature is in degrees C and precipitation
in total monthly accumulation in millimeters.
- CO.MAM.ppt CO.MAM.tmax CO.MAM.tmin Spring seasonal means (March, April,May)
as two dimensional arrays ( Year, Station).
Quick example using the fields library
Plots are saved in png format as files but this is only done to
be consistent with figures that included on this webpage
(see below).
Load fields and the CO datasets
Do this just once per R session
library( fields)
attach("COmonthly.met.rda")
Spatial plot of 1997 Spring average daily maximum temps
png("fig3.png",width=480, height=360)
quilt.plot( CO.loc,CO.tmax.MAM[103,] )
US( add=T)
title( "Recorded MAM max temperatures (1997)")
dev.off()
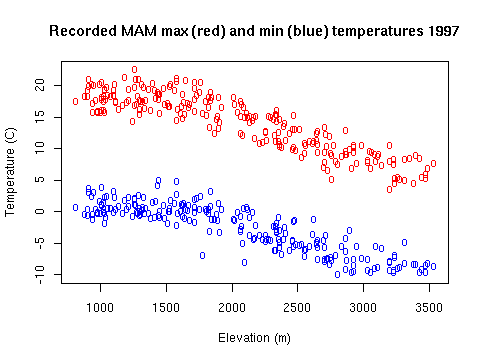
png("fig4.png",width=480, height=360)
matplot( CO.elev, cbind( CO.tmax.MAM[103,], CO.tmin.MAM[103,]),
pch="o", type="p",
col=c("red", "blue"), xlab="Elevation (m)", ylab="Temperature (C)")
title("Recorded MAM max (red) and min (blue) temperatures 1997")
dev.off()
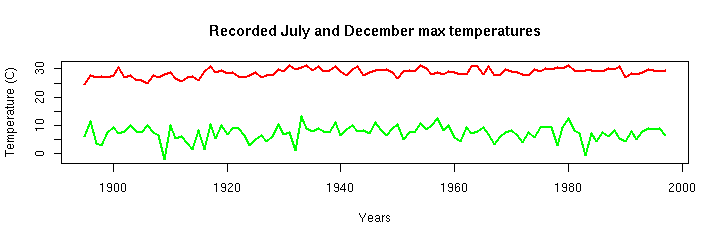
Time series plot of Boulder, CO July and December temperatures
png("fig5.png",width=720, height=240)

# you should check that
#  CO.names[15] is actually BOULDER!

matplot( 1895:1997, CO.tmax[,c(7,12),15],
   type="l", lwd=2, lty=1, col=c("red", "green"),
   xlab="Years", ylab="Temperature (C)")
title("Recorded July and December max temperatures")

dev.off()