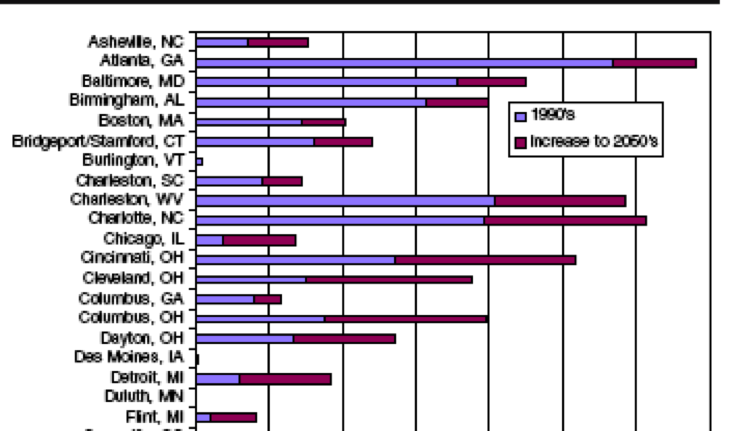
Average number of
exceedence days per summer for each city for the 8-h ozone NAAQS. The blue
bars represent the average number of exceedence days prt summer for the
current climate, whereas the red bars represent the additional number of
exceedence daysthat would occur
under the projected future climate scenario