|
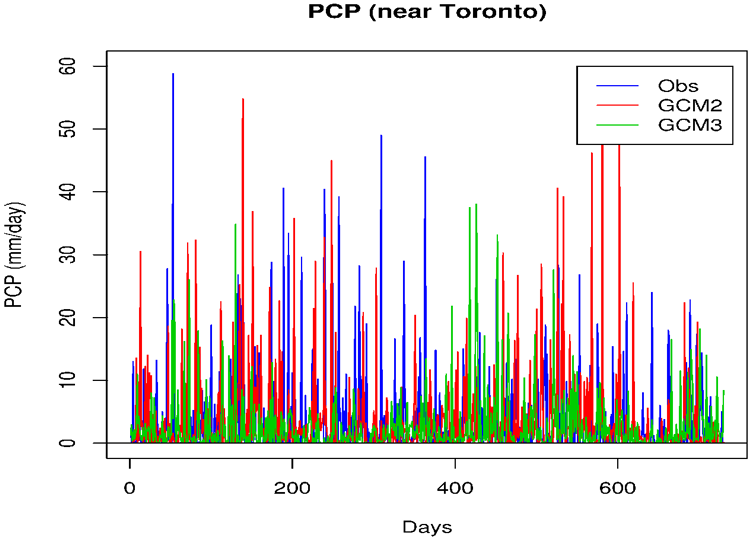
24 hour precipitation as
observed at the Toronto Airport during a 2-year period and as simulated by
two generations of the CCCma atmospheric general circulation model at a grid
point near Toronto. The diagram demonstrates
that these GCMs simulate precipitation variability that is similar to that
which is observed. The more
recent version of the model (AGCM3) appears to produce smaller precipitation
extremes at this particular location that the earlier version of the model.
Scale considerations suggest that models should simulate smaller
precipitation extremes than observed, and that there should be increasing
agreement as the resolution of the model increases.
|