
|
|
|
| Contact Us | Visit Us | UCAR People Search | Numerics| Assimilation| Turbulence| Statistics |
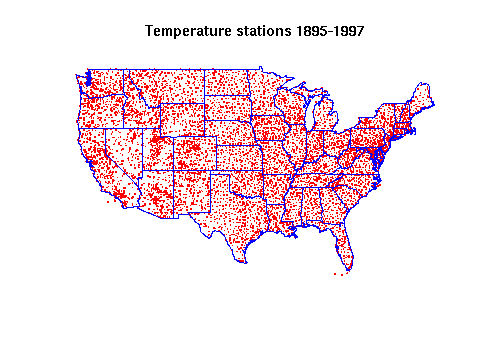
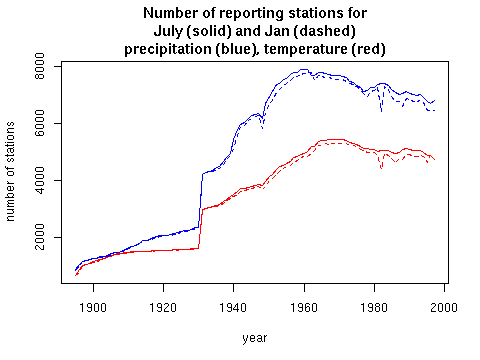
There are approximately 8000 stations reporting temperatures and approximately 12000 stations reporting precipitation at some time in this period. However, the maxmimum number of stations with data on any given month is substantially less reaching a maximum of around 6000. Stations have been included in these data sets only if they report 10 or more years data.
The observational data (infilled values omitted) formatted as a R binary data file These objects include all the meta data and format the values as a multi-dimensional array on year/month/location. Temperatures are in degrees centigrade and precipitation monthly totals in millimeters. By the monthly average daily minimum (maximium) temperature we mean that the daily minimum (maximum) temperatures and are measured throughout the month and their sample mean is reported.
A convenient subset of min/max temperature and precipitation for Colorado stations has been formatted as an R data object. See Colorado Monthly Meteorological Data for these data and also a "soup to nuts" script for creating R datasets from the more more general data sets described below.
Much of our analysis uses the R package and we also recommend the Fields library for plotting and spatial analysis.
 |
 |
The data sets, software and related content in and linked to these pages are intended for scientific and mathematical research. The authors do not guarantee the correctness of the data, software or companion text. Please see the UCAR Terms of Use listed below.
© 2010, UCAR |
Privacy Policy |
Terms of Use |
Contact UCAR | Visit UCAR |
Sponsored by
