•Anthropogenic influence detected in
indices of cold nights, warm nights, and cold days
Christidis, et al 2005
Alexander, Zhang, et al 2005
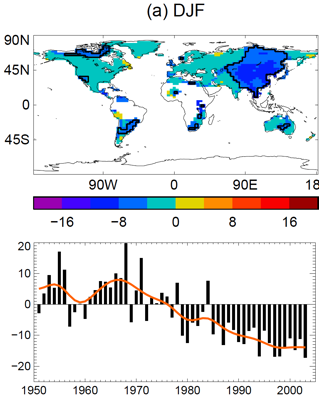
DJF Cold nights
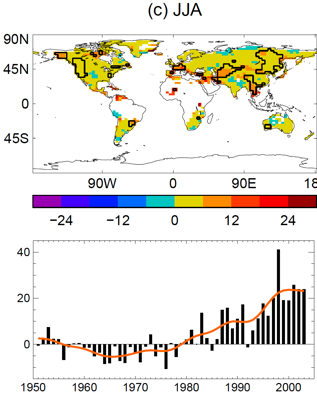
JJA warm days
Fig.2: Trends (in days per
decade, shown as maps) and globally averaged annual time series anomalies
relative to 1961-1990 mean values (shown as plots) for annual series of
percentile temperature indices for 1951-2003 for (a) cold nights (TN10p),
(b) warm nights (TN90p), Trends were calculated only for the grid boxes
with sufficient data (at least 40 years of data during the period and the
last year of the series is no earlier than 1999). Black lines enclose regions
where trends are significant at the 5% level. The red curves on the plots are
the 21-term binomial fit to the data.
Other indices consistent
– cold days, cold nights, frost days