¥Uneven availability in space and time
¥Weak spatial dependence
¥Spatial averages over grid boxes may not be good estimates of Ògrid boxÓ quantities simulated by climate models
–
Observational data rather messy
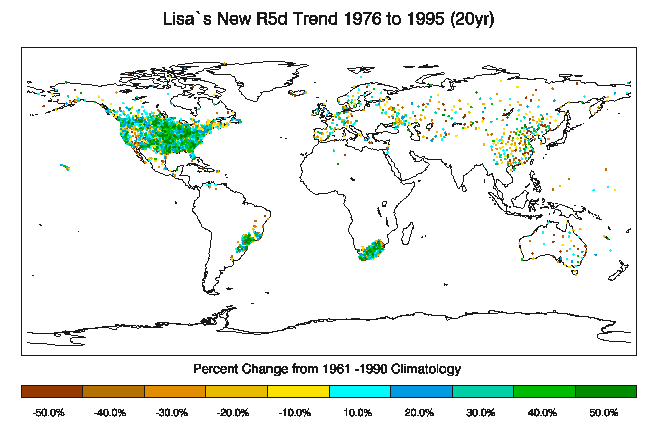
Trend 5-day max pcp 1950-99 (data: Alexander et al. 2006)
2nd difficulty: Large uncertainty in observed changes.
Top: annual total rainfall from 1 5x5o Gridbox, 50ish stations: sample only 3 (as available over large parts of world only): => variability and trend quite uncertain.

Bottom: coverage of daily extreme rainfall, here for trend in wettest 5-day period in year. Data collected by Alexander et al. => very varying data density, many regions without coverage
High density: US and ZA.
Also look at spatial inhomogeneity in trends: very patchy!

All these things make it difficult to convince ourselves which observed changes are due to greenhouse gas increases.