
NCAR Summer School, 13
August 2008
Regional
Climate Models
Increased computing power has allowed finer resolution
1990
1996
2001
2007
| [Note
first: GCMs use a planet divided
into small regions (grid boxes) and compute their equations for each grid
box.] |
|
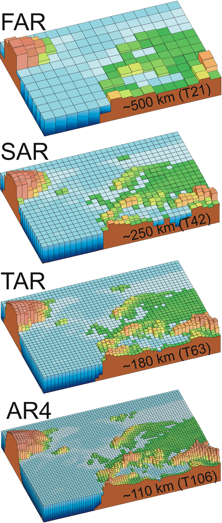
| Figure 1.4. Geographic
resolution characteristic of the generations of climate models used in the
IPCC Assessment Reports: FAR (IPCC, 1990), SAR (IPCC, 1996), TAR (IPCC,
2001a), and AR4 (2007). The figures above show how successive generations of
these global models increasingly resolved northern Europe. These
illustrations are representative of the most detailed horizontal resolution
used for short-term climate simulations. The century-long simulations cited
in IPCC Assessment Reports after the FAR were typically run with the previous
generation’s resolution. Vertical resolution in both atmosphere and ocean
models is not shown, but it has increased comparably with the horizontal
resolution, beginning typically with a single-layer slab ocean and ten
atmospheric layers in the FAR and progressing to about thirty levels in both
atmosphere and ocean. |
|