
|
|
|
| Contact Us | Visit Us | UCAR People Search | Numerics| Assimilation| Turbulence| Statistics |

These data form the basis for a extended example using the
fields package for fitting and manipulating curves and surfaces. Refer to the poster, presented at the
Joint Statistical Meetings 2007 for more details on the statistics. The
three data components for this example are located in the
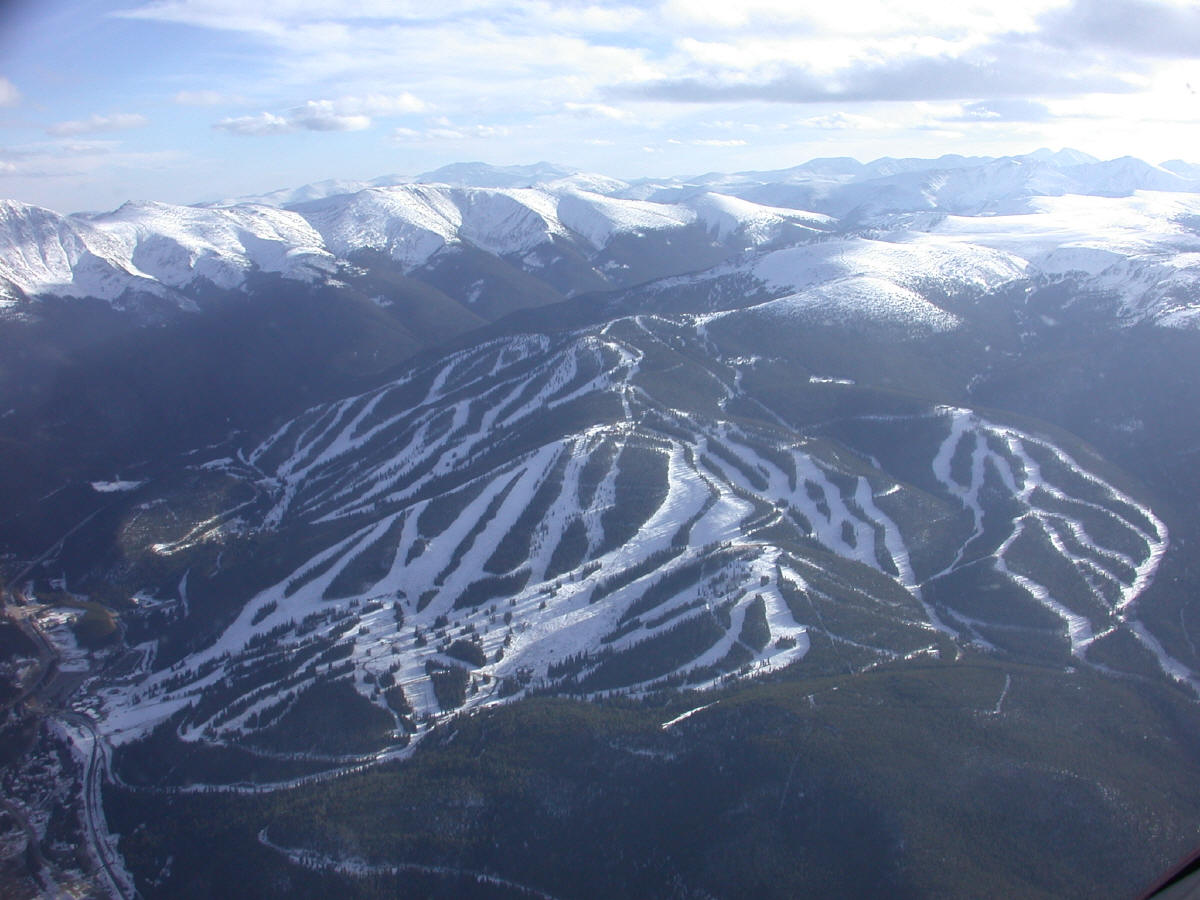
WinterPark Mary Jane Ski resort in Colorado and centered around the
Super Gauge lift and Riflesight notch ski trial.
The Mary Jane Project (MJP)
is a web based guide for the primary ungroomed trails
at Winter Park/Mary Jane ski resort. This page provides some
quantitative analysis of one run that is part of the MJP.
We would like to acknowledge Allie Nychka from MJP for sharing her
broad knowledge on the ski area.
The R datasets and supporting functions are contained in the R binary format file RifleSight.rda and can be obtained from the data directory http://image.ucar.edu/public/Data . (just download this file -- don't let your browser try to display it!)
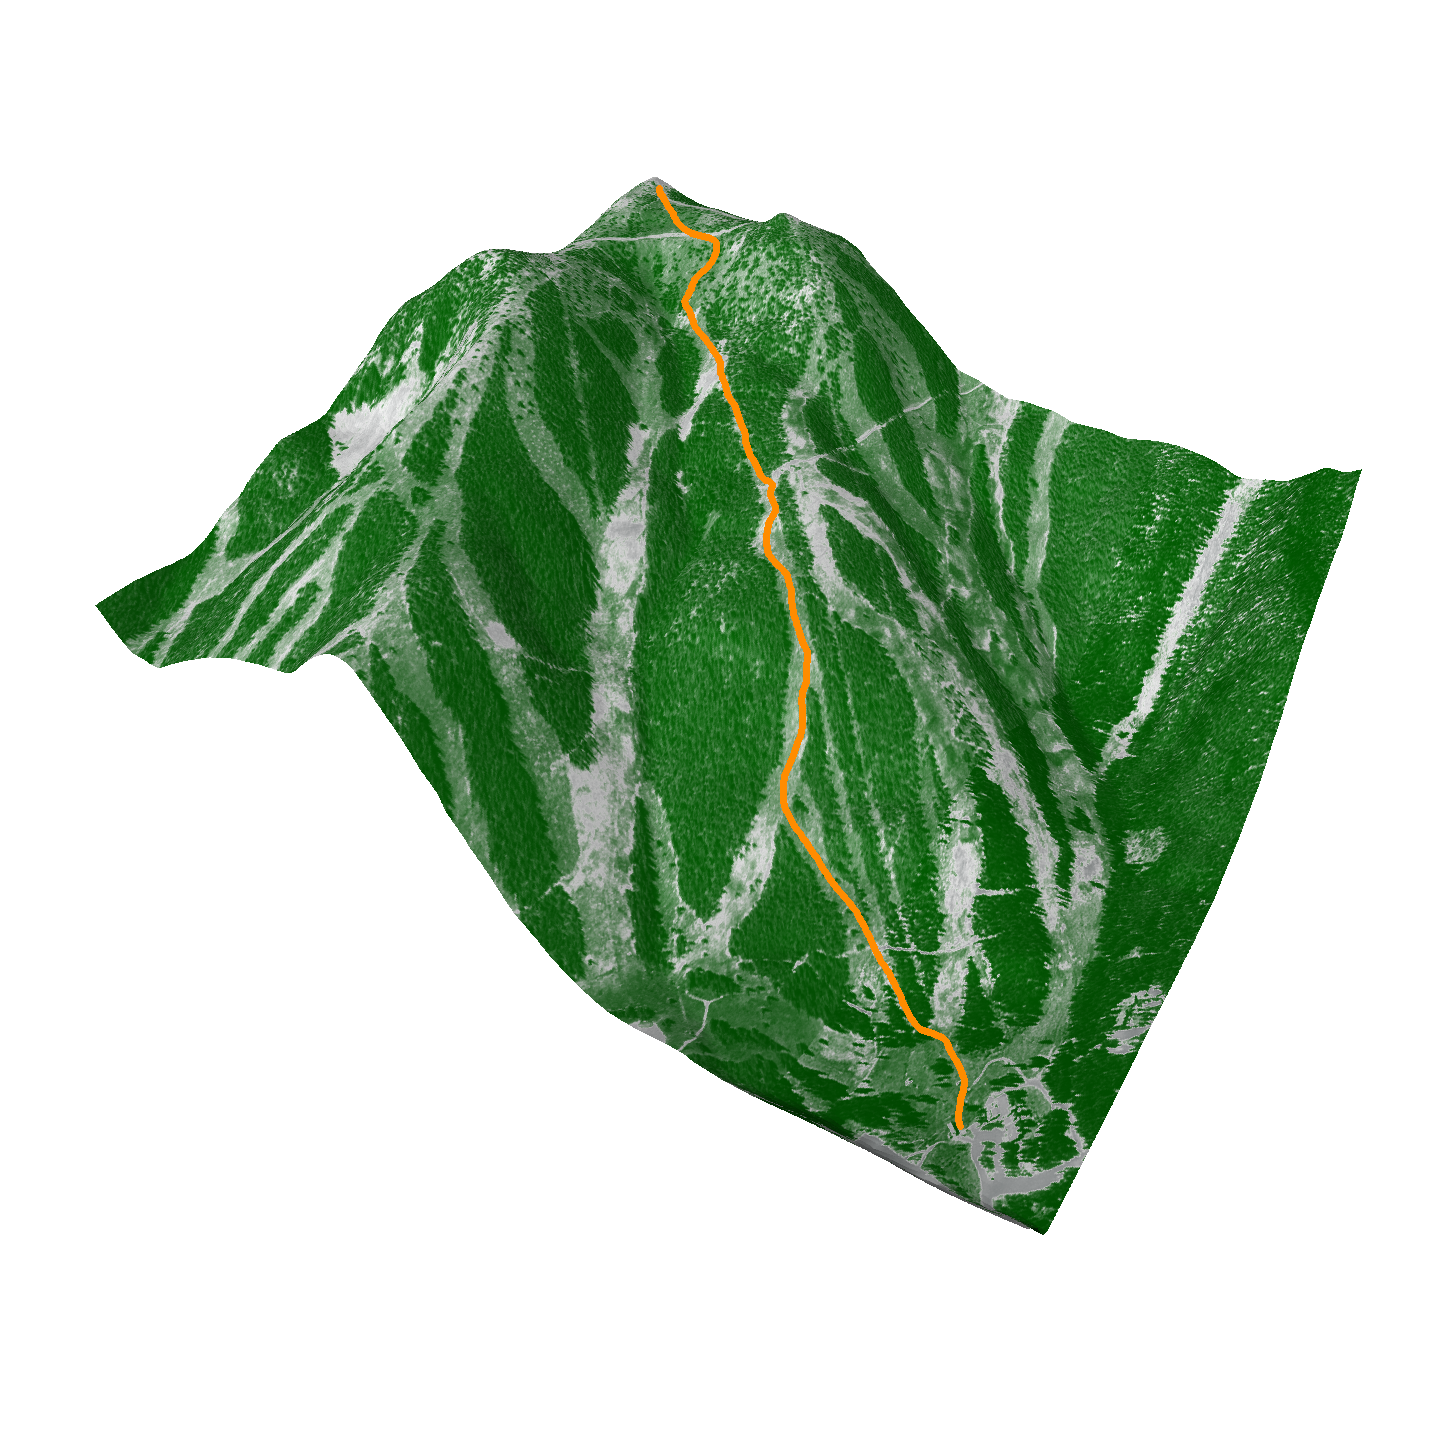
Digital orthophoto on a 1155X2003 grid. Range of grey levels is 5 to 254. R dataset name is RifleI. Detailed meta data provided with the download describes the process and accuracy of this image. The raw image is in tiff format. This was converted to pnm format and then read into R using the pixmap package. RifleE is a simple bilinear interpolation of the DEM elevations to the finer image grid created in fields using interp.surface.grid
Riflesight trail. Using the locator function a skiing run was input begining at the top of the Super gauge lift, dropping down Sluice Box, continuing under the lift to Riflesight, emptying out on Feebleminded to finish at Super Gauge lift. RifleI is matrixwith 400 lon/lat locations describing the run and rifle.trail.elev are the interpolated elevations in meters. See the Trail Map for what skiers typically use to navigate.
Both image datasets were obtained through the USGS seamless data
distribution service. These images are in standard R image list format with
components x
the grid values for longitude, y the grid for
latitudes and z a
matrix of values.
Additional components are
 |
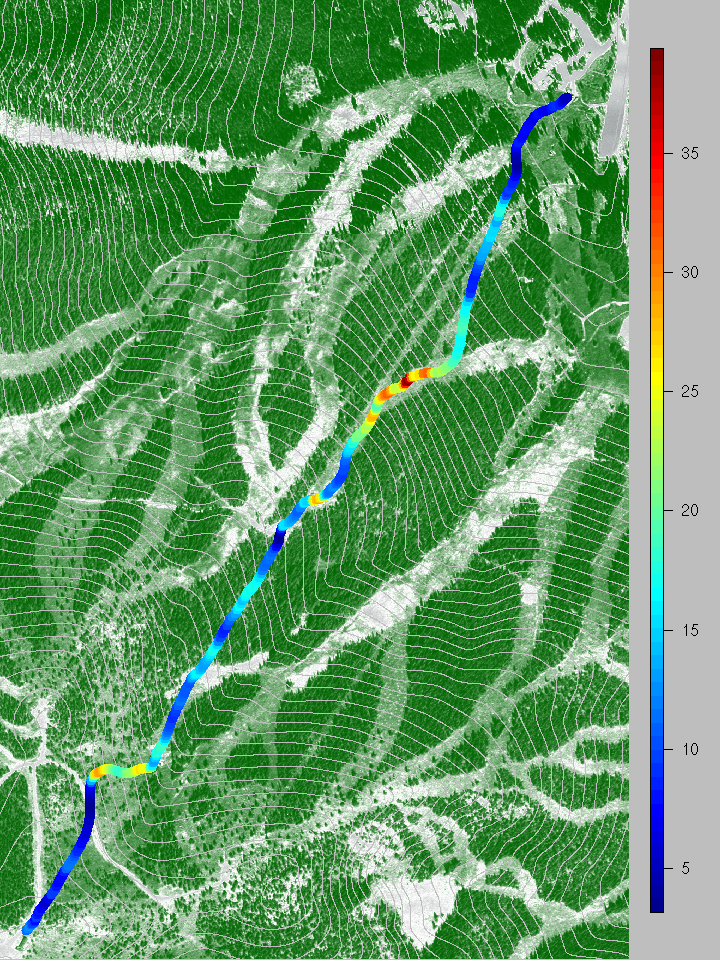 |
| fig3.RifleSight | fig4.RifleSight (Ski run from Lower left to upper right) |
The data sets, software and related content in and linked to these pages are intended for scientific and mathematical research. The authors do not guarantee the correctness of the data, software or companion text. Please see the UCAR Terms of Use listed below.
© 2010, UCAR |
Privacy Policy |
Terms of Use |
Contact UCAR | Visit UCAR |
Sponsored by
