
Daily Surface Ozone data for 1995-1997 Eastern US
These data are used in several publications developing statistical methods for spatial data and for extremes. There were originally obtained from William Cox USEPA through the AIRS data base although these data can be reconstructed by obtaining from the hourly measurements from US EPA AirData and choosing the link to the Air quality system (AQS). ozmax8.rda is an R image object about 600Kb size) that contains daily ozone measurements and related station and date information over the period 1995-1999. See READMEozmax.txt for a description of the list components. The script work.R describes the manipulations of the dates from the original data formats, with original data files in this directory. The script work2.R uses the R data object and shows the steps for deseasonalizes the raw data. This script also gives the user some ideas how to plot and describe these data. The resulting deseasonalized residuals are more amenable to spatial modeling.
Sample R code:
To attach the binary datra object in an R session:
attach( "ozmax8.rda")
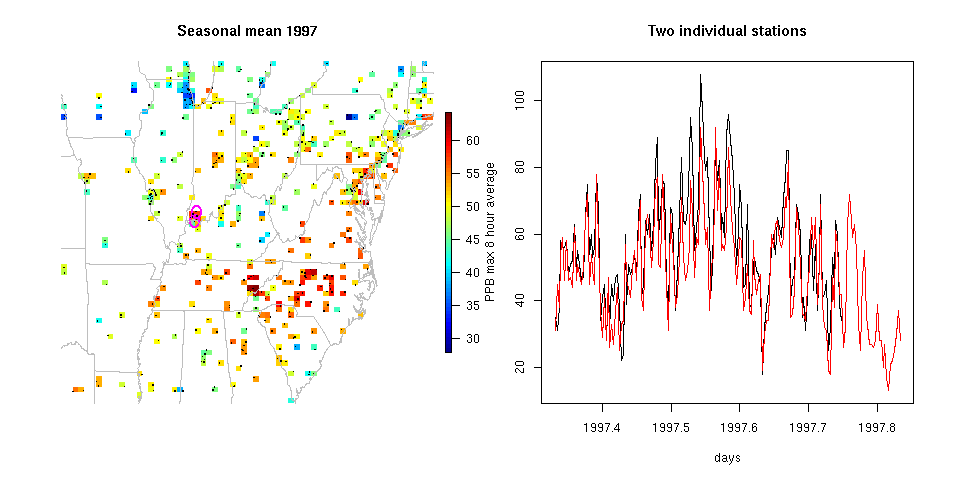
Code to draw the figure above. You will need the
fields R package for
this.
library( fields)
load( "ozmax8.rda")

 ind<- c(125,  149) # two adjacent stations in Southern Indiana
 ind2<- years(ozmax8$dates) ==1997

 stats( ozmax8$PPB[ind2,])-> look

set.panel( 1,2)
# nice image plot of seasonal means
 quilt.plot( ozmax8$lon.lat, look[2,],axes=FALSE, xlab="", ylab="",
         legend.shrink=.7)

 points( ozmax8$lon.lat[ind,], pch="o", cex=2, col="magenta")
 points(  ozmax8$lon.lat, pch=".", col="black", cex=2)

 title( "Seasonal mean 1997")
 US( add=TRUE, col="grey")

# time series plots to check for correlations for stations that are
#  close.

 matplot( ozmax8$years[ind2], ozmax8$PPB[ind2,ind],
   type="l", col=c(1:3), lty=1,
   ylab="PPB max 8 hour average", xlab="days")
 title("Two individual stations")
DISCLAIMER:
The data sets, software and related content in and linked to these pages are intended for scientific and mathematical research. The authors do not guarantee the correctness of the data, software or companion text. Please see the UCAR Terms of Use listed below.