Spring 2013 Realtime WRFDART analysis
For the latest ensemble forecast see
here
Analysis Date
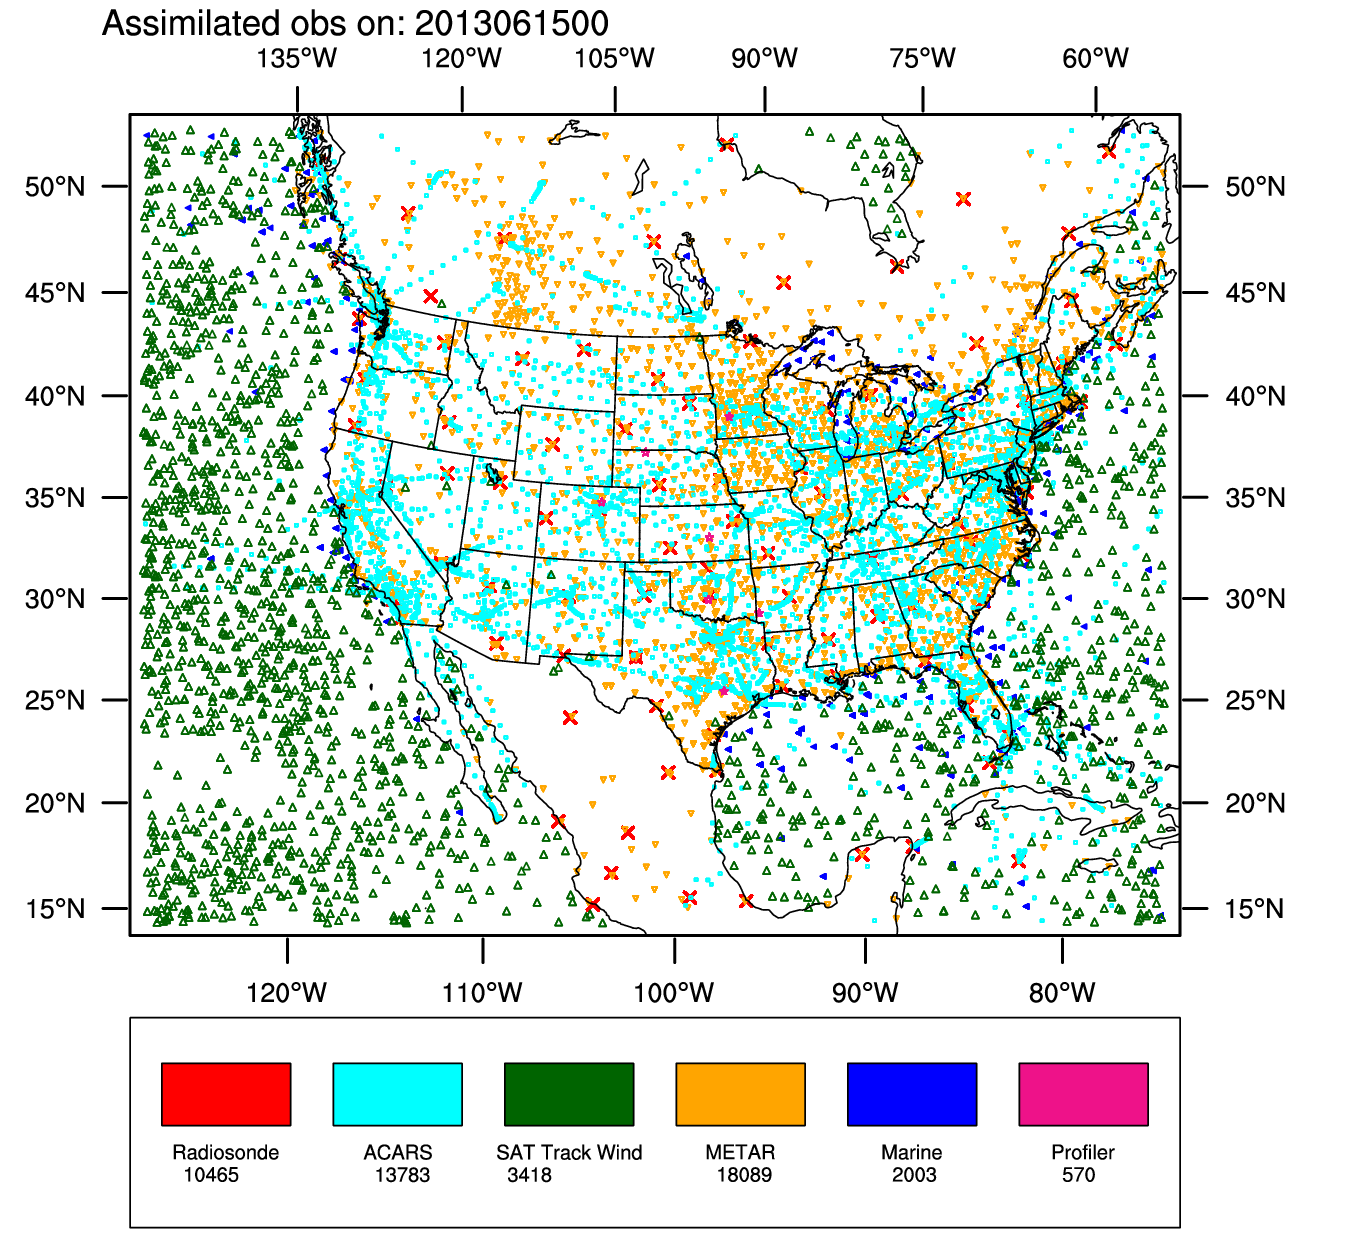
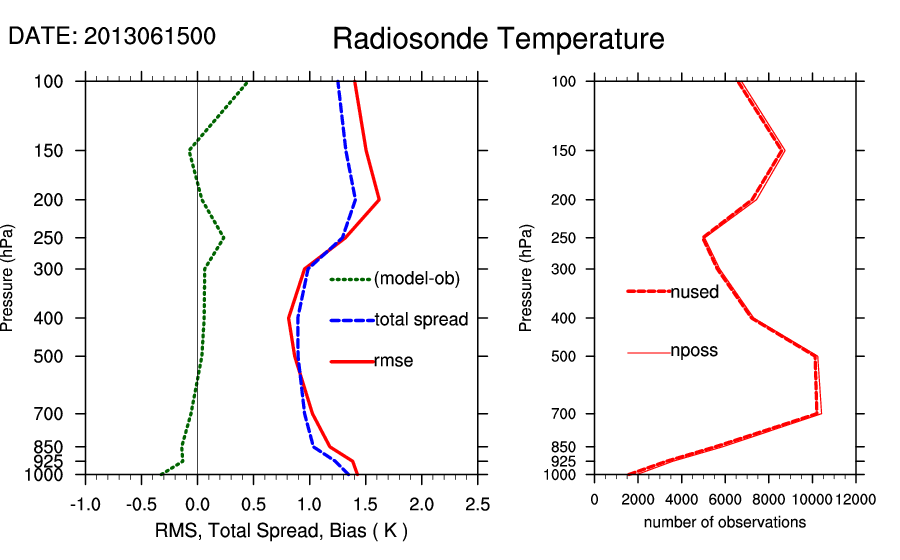
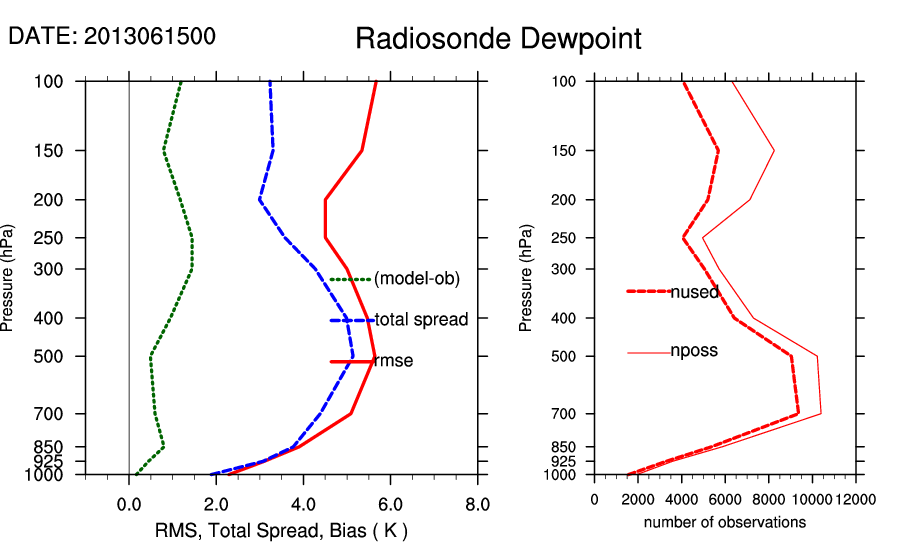
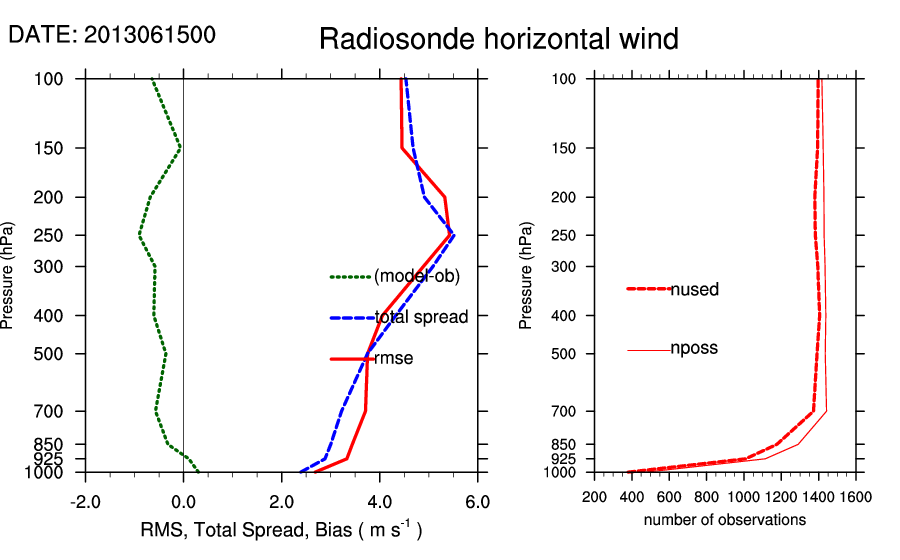
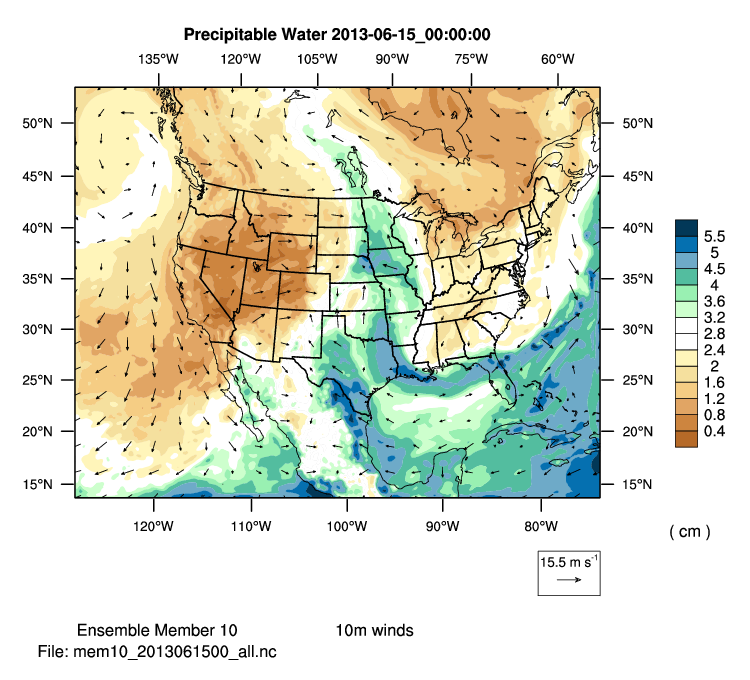
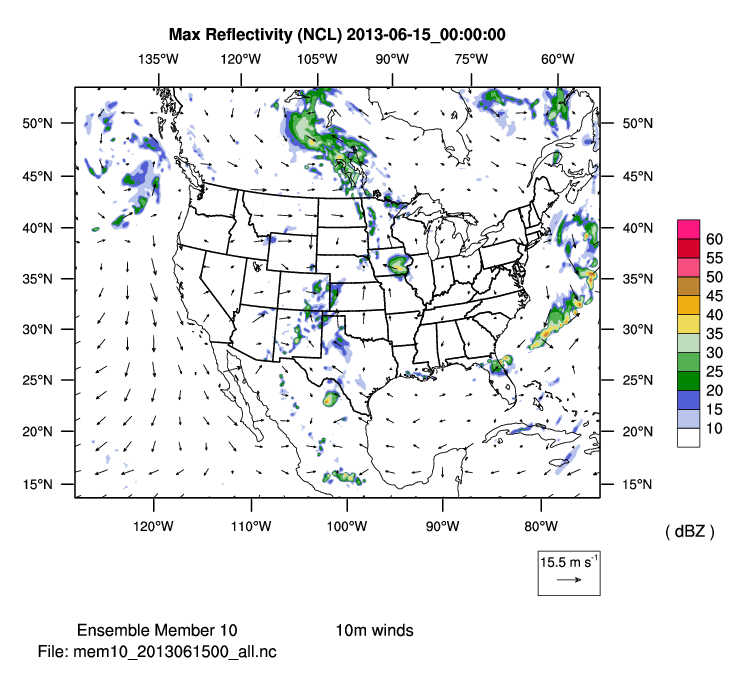
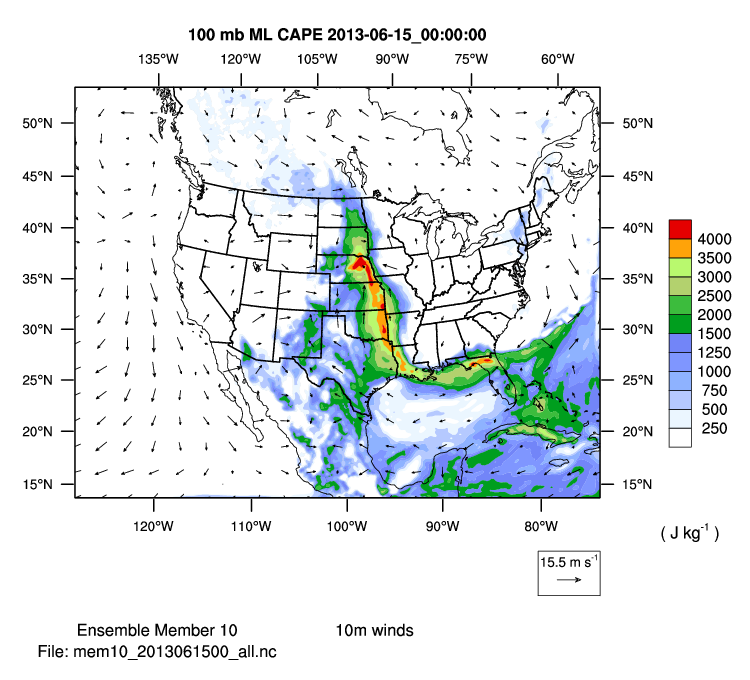
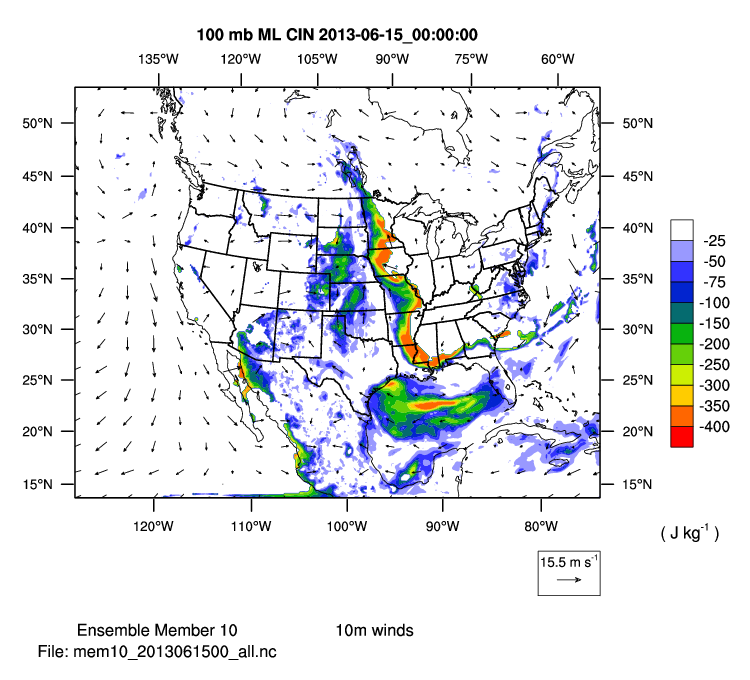
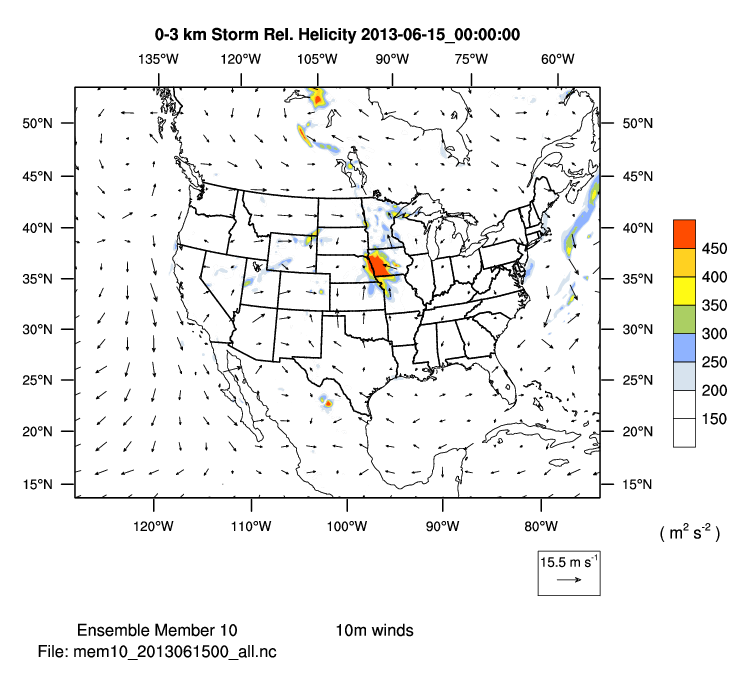
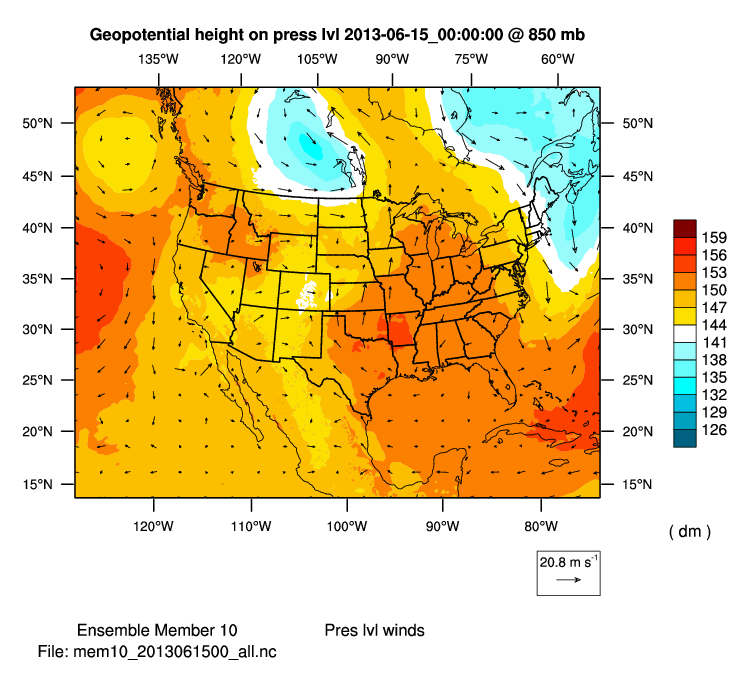
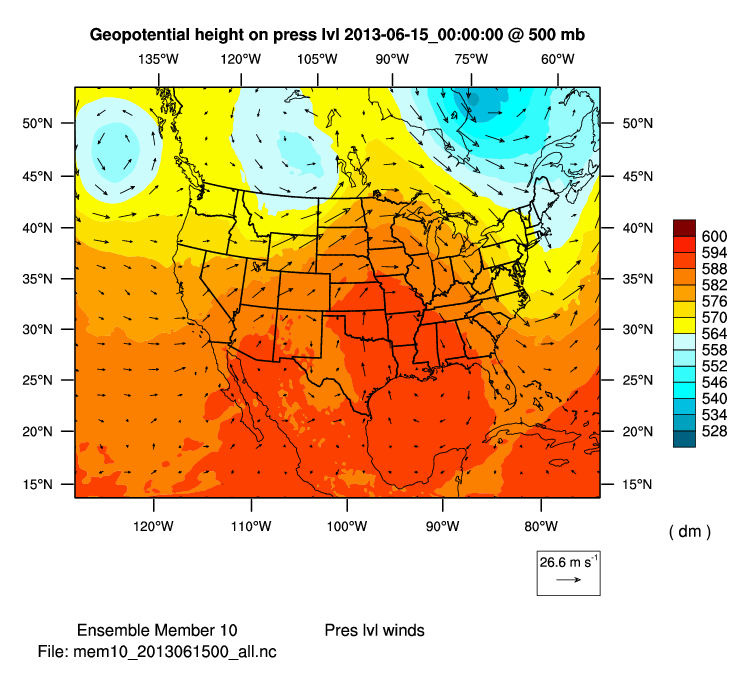
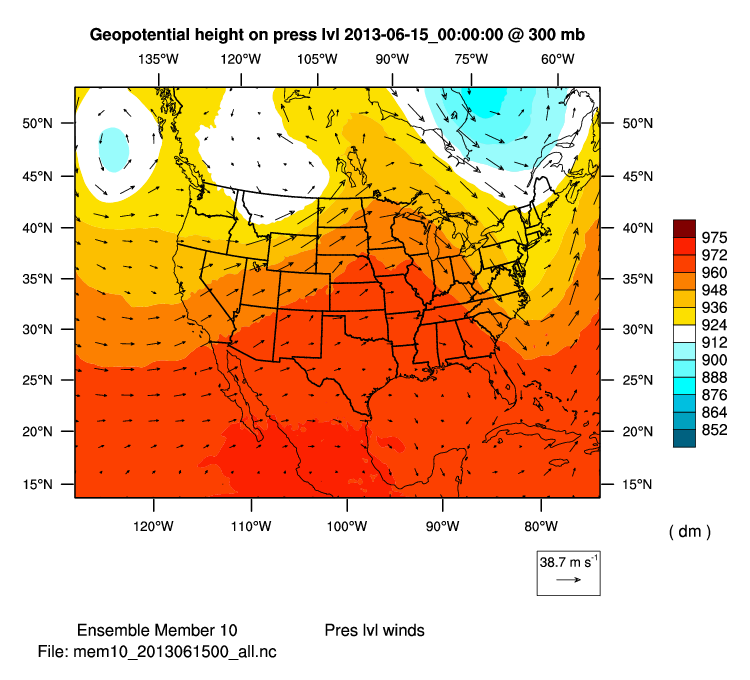
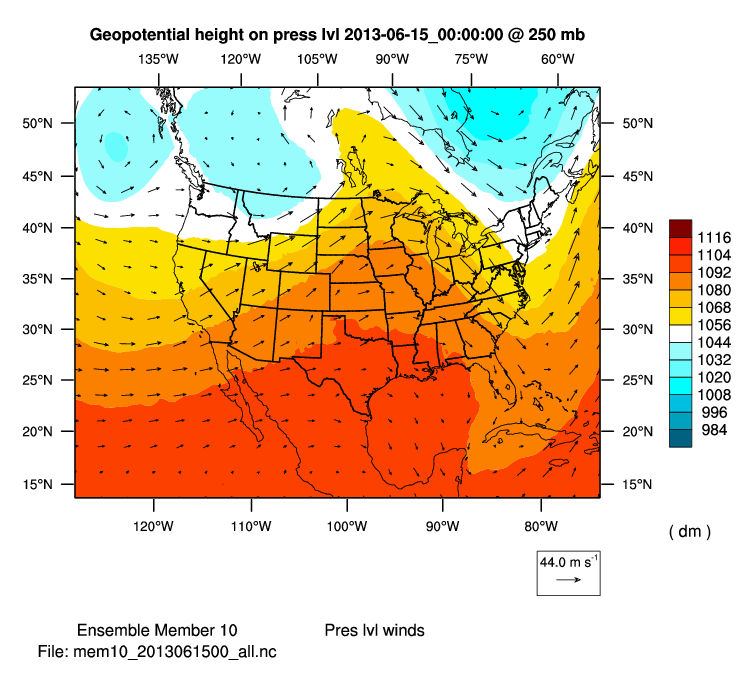
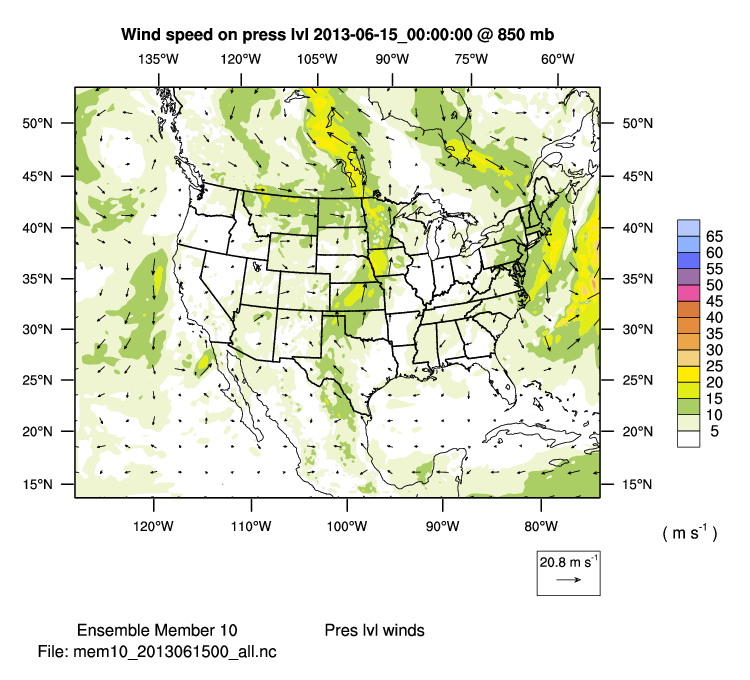
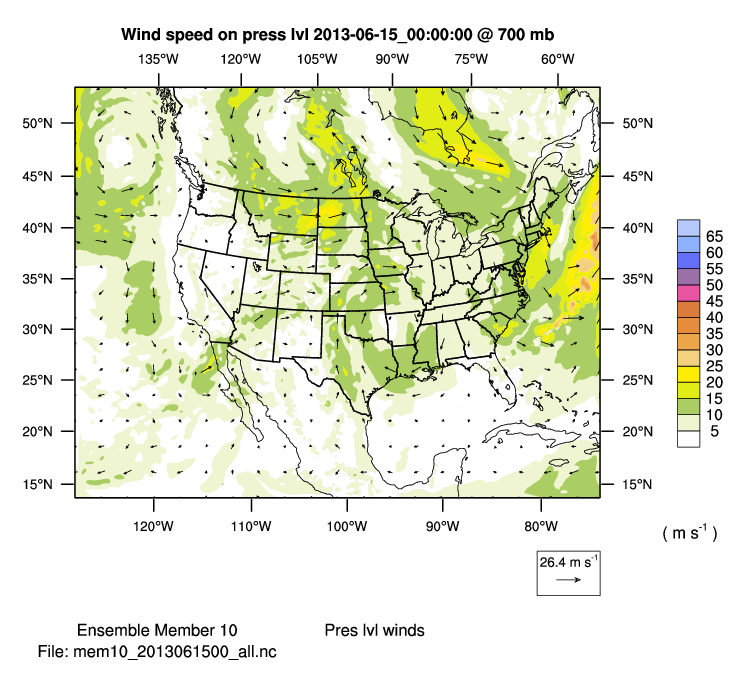
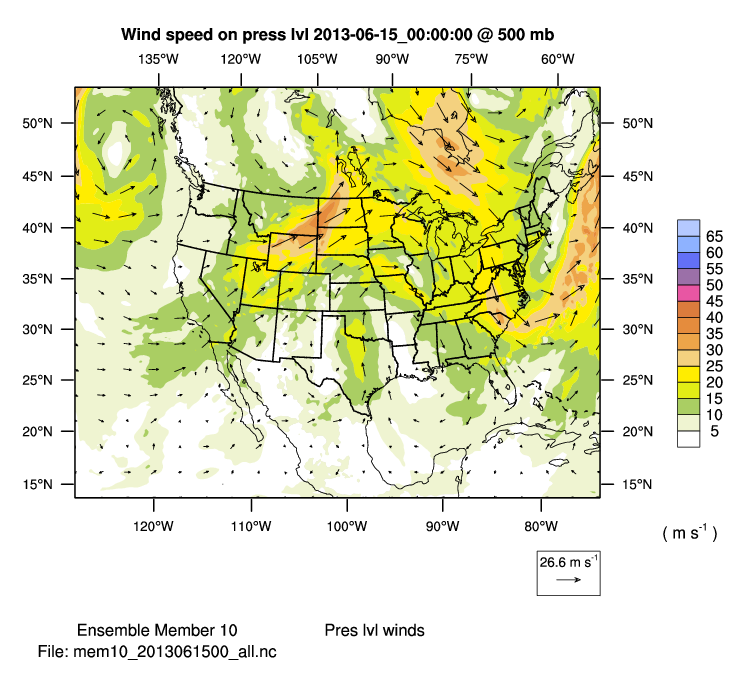
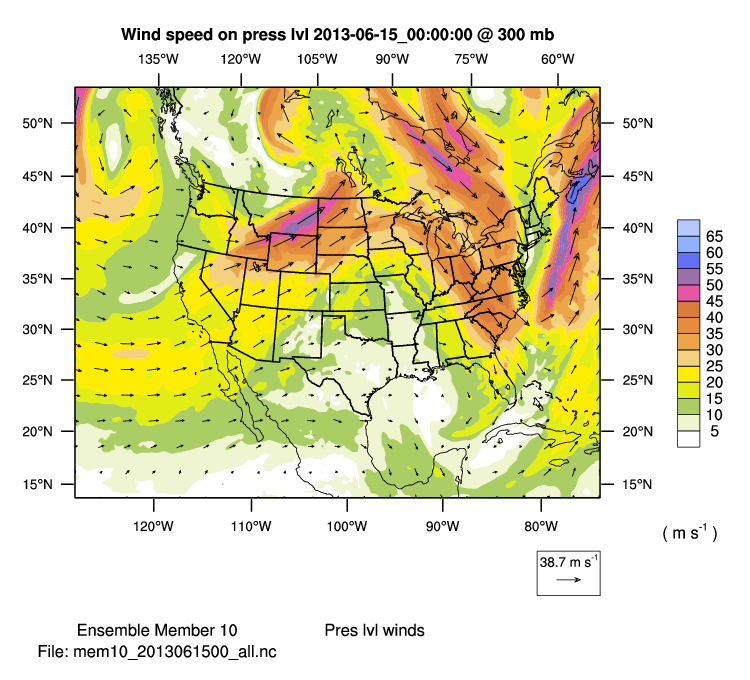
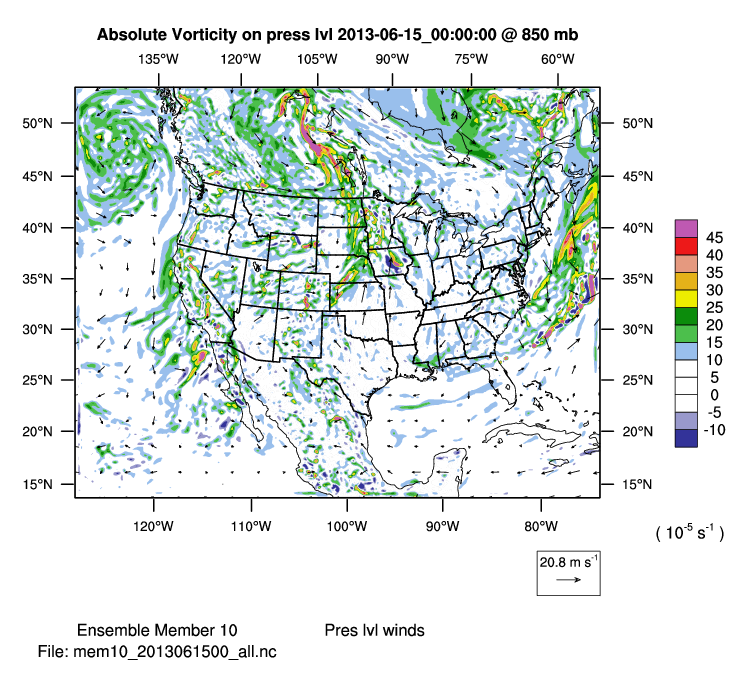
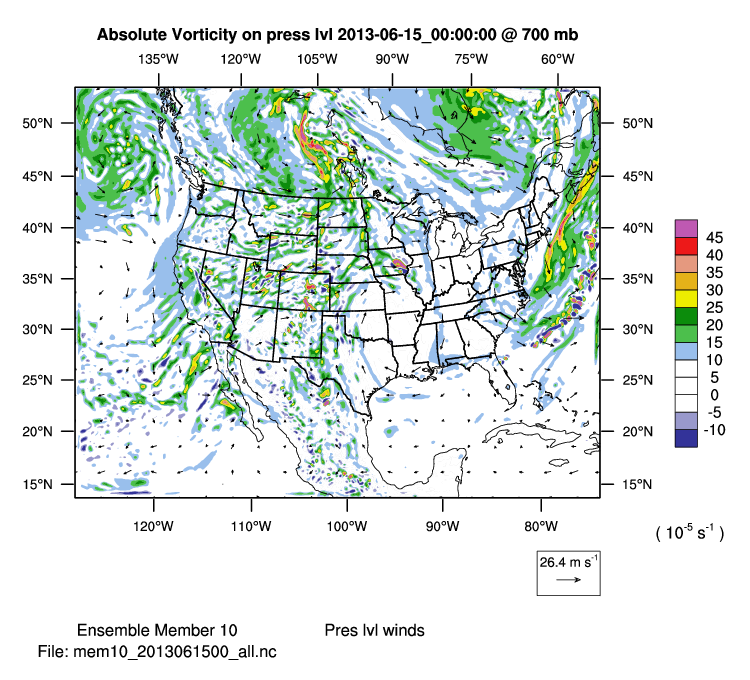
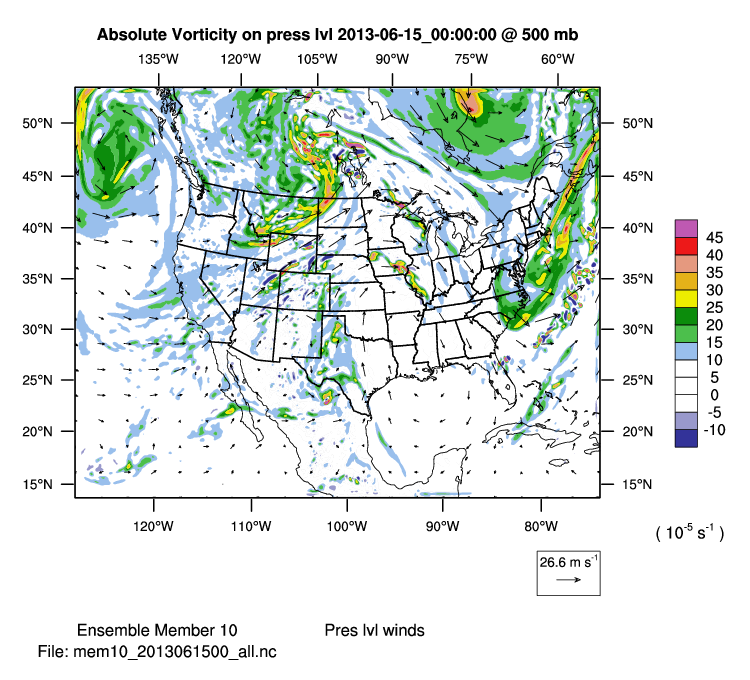
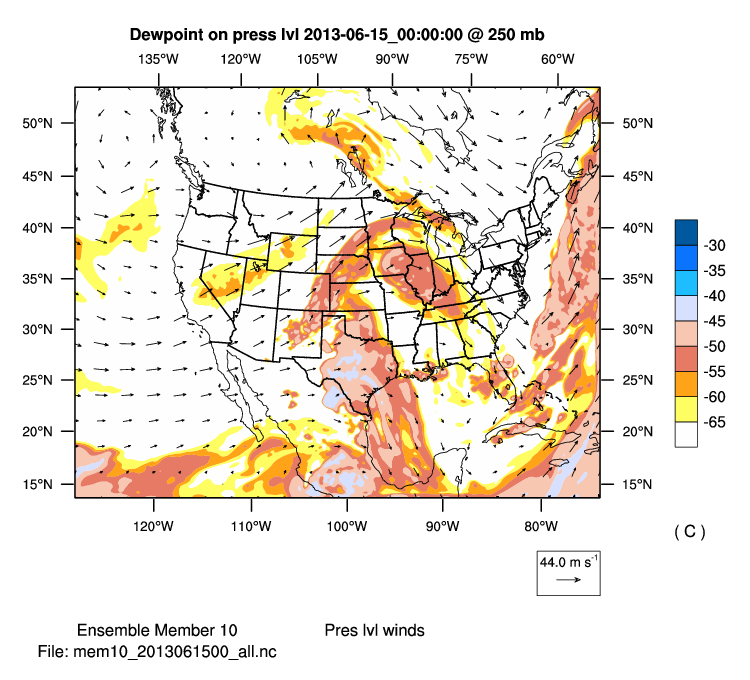
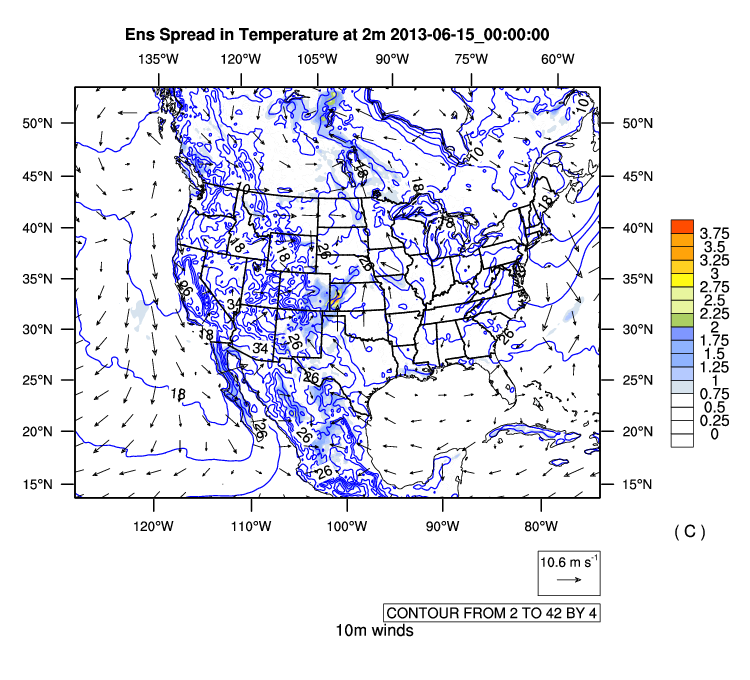
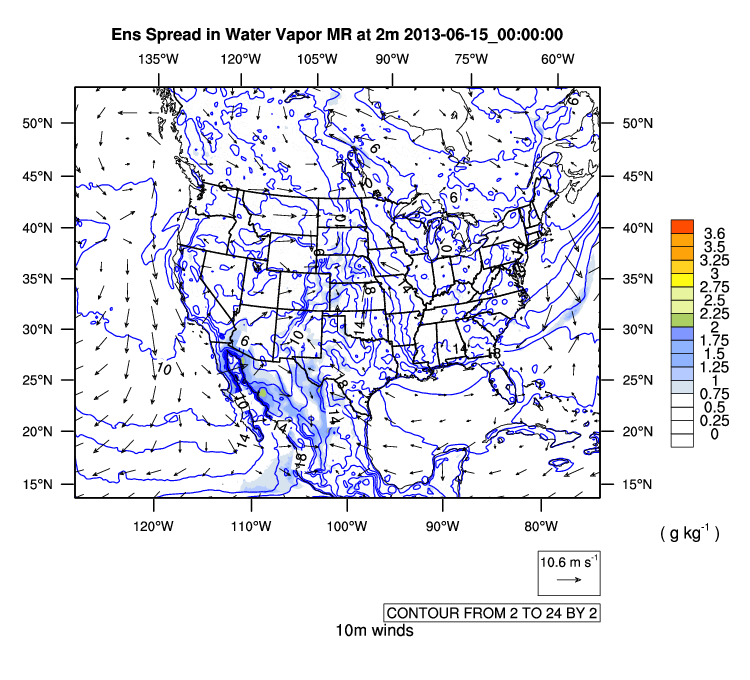
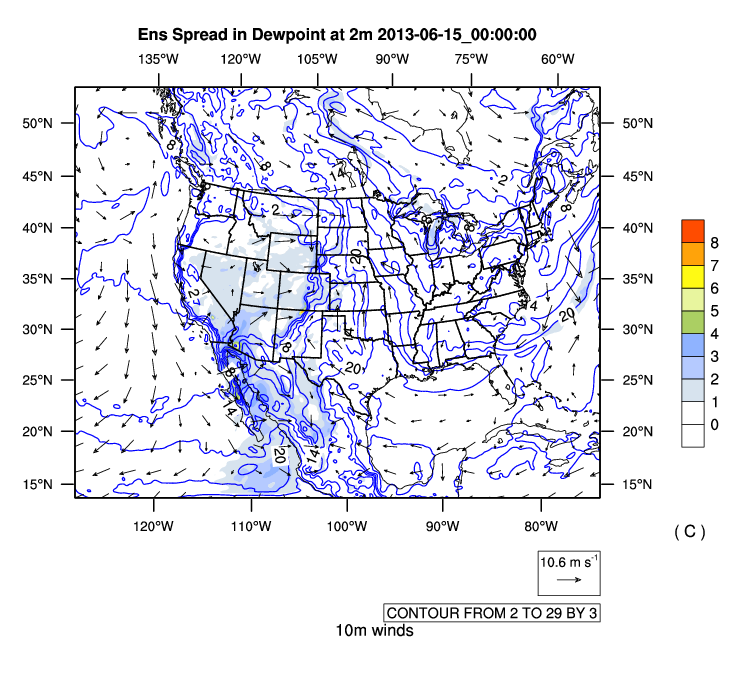
2013061500
(YYYYMMDDHH)
Observation Diagnostics
Observation locations
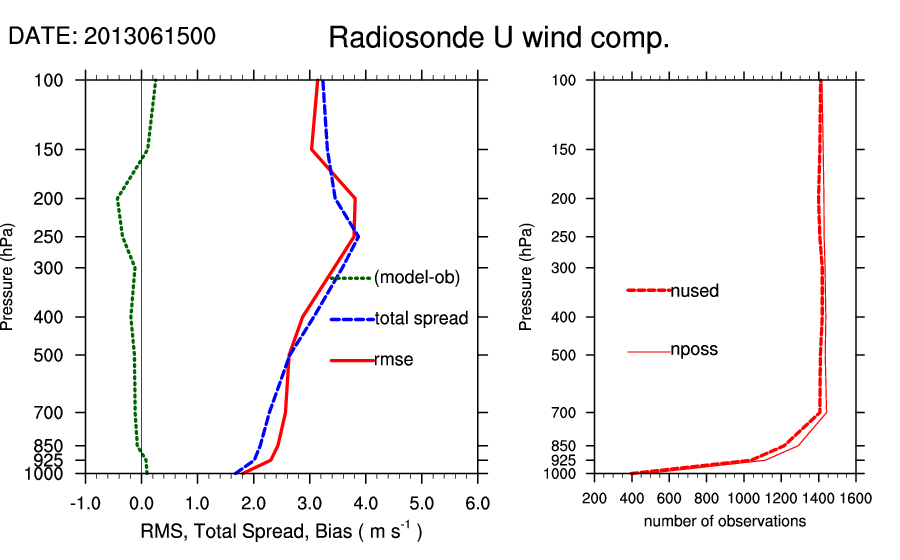
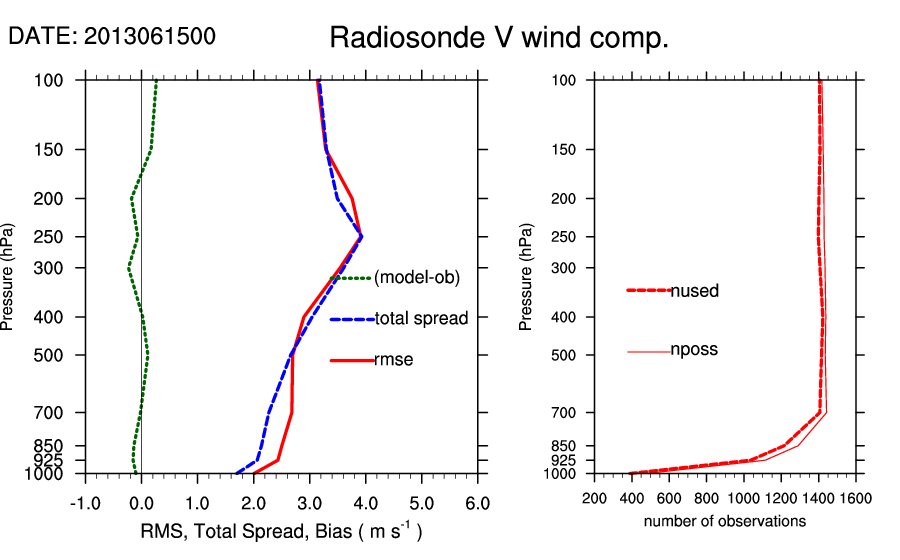
Rsonde prior verif. (7 day ave.):
Temperature
Dewpoint
Horizontal Wind
U Wind
V Wind
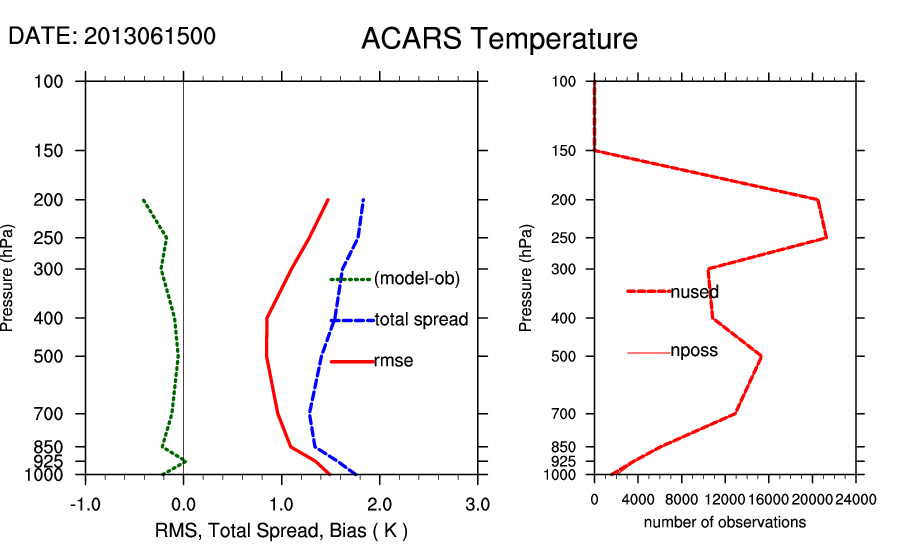
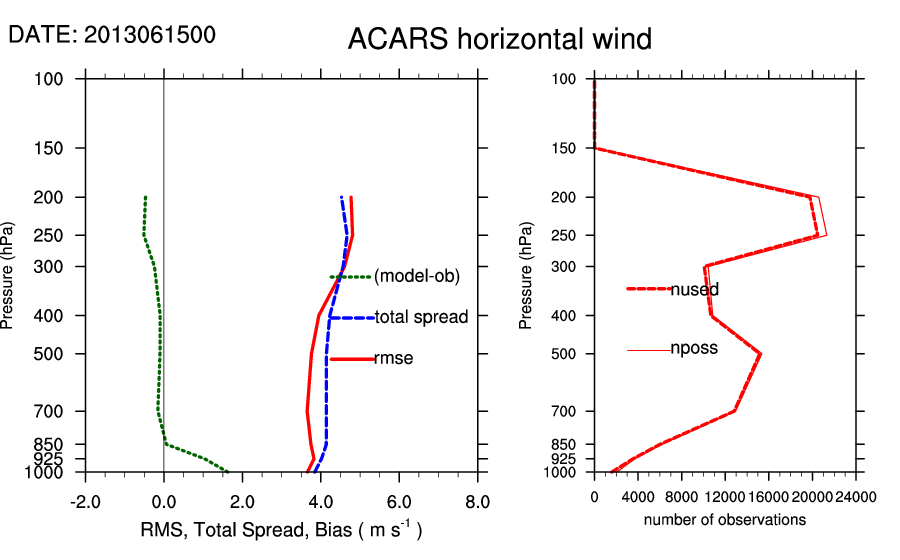
ACARS prior verif. (7 day ave.):
Temperature
Horizontal wind
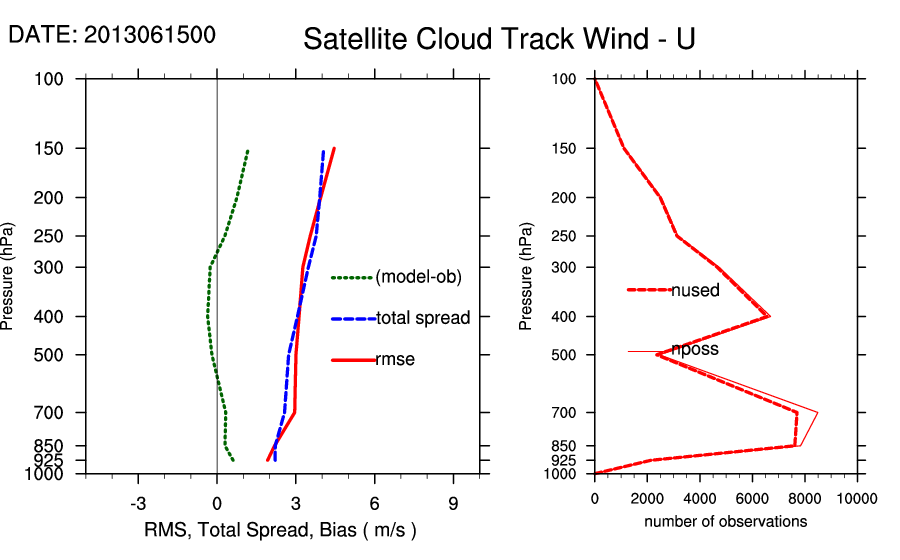
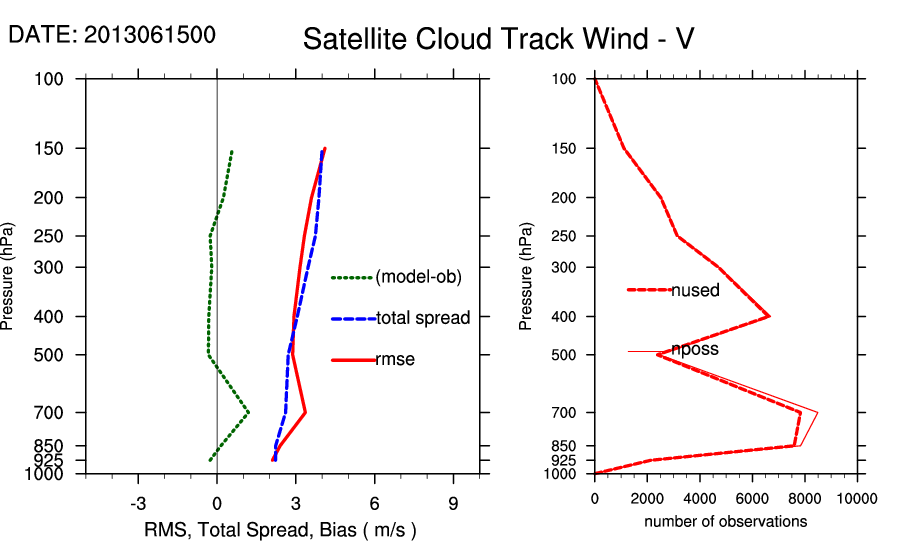
Sat. winds prior verif. (7 day ave.):
U Wind
V Wind
GPS RO prior verif. (7 day ave.):
GPS RO
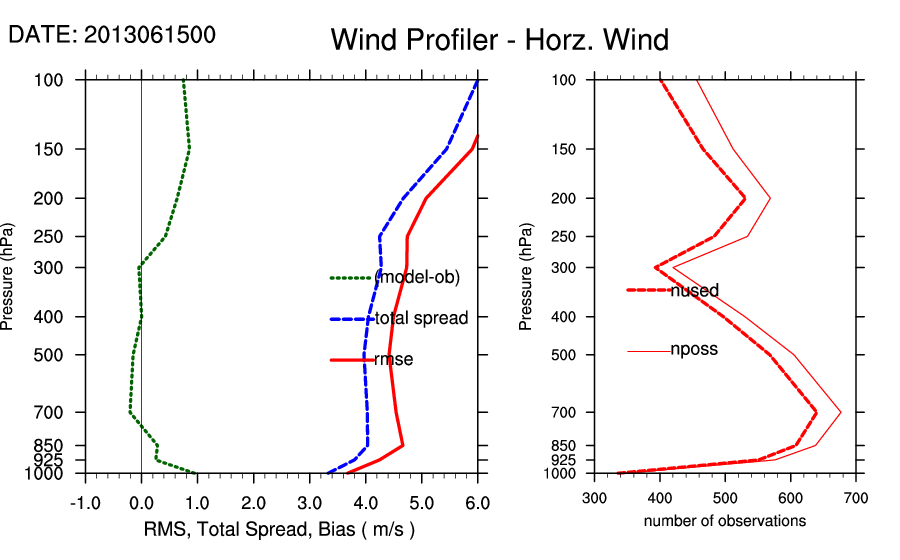
Wind profiler prior verif. (7 day ave.):
Horizontal wind
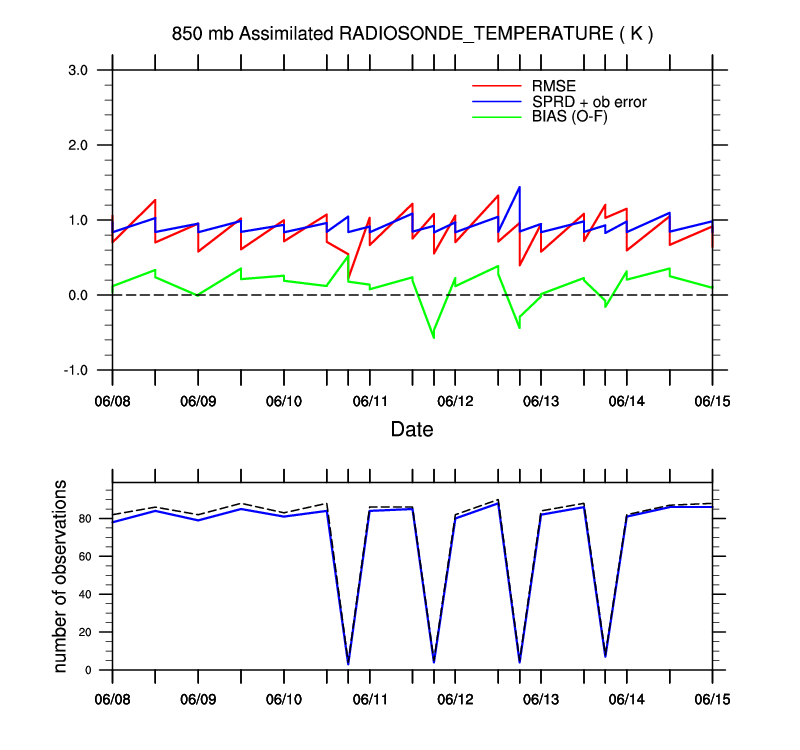
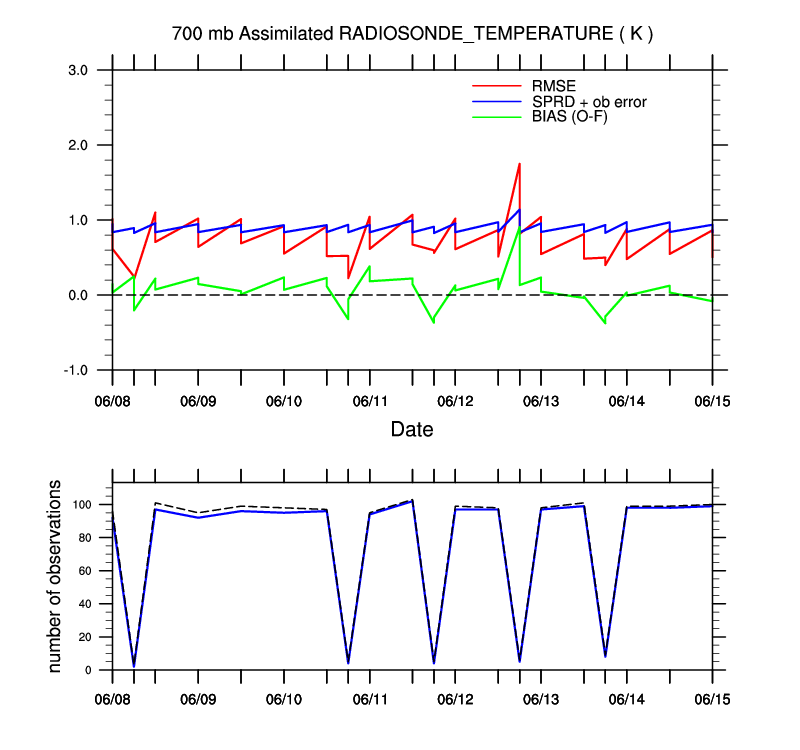
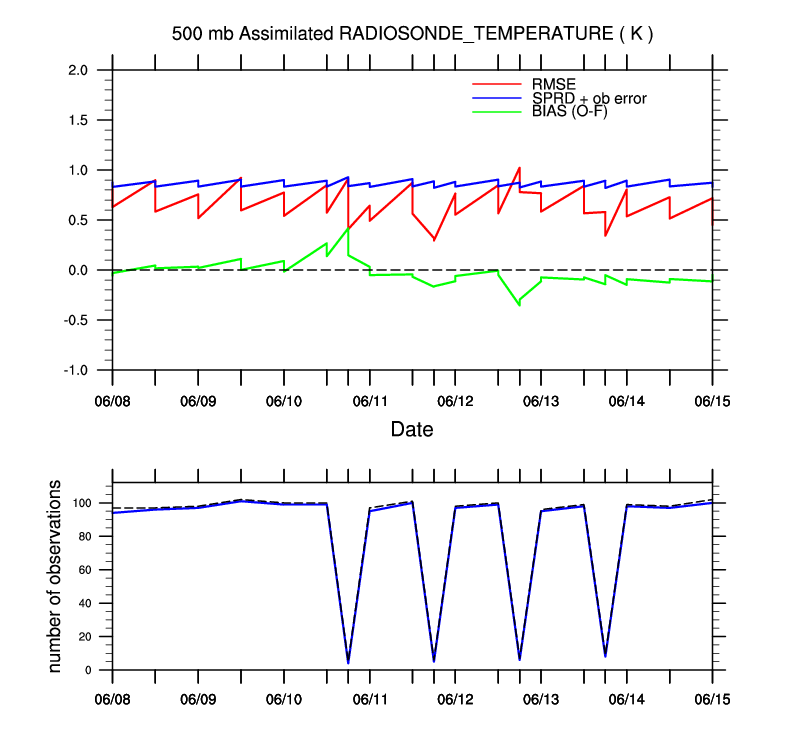
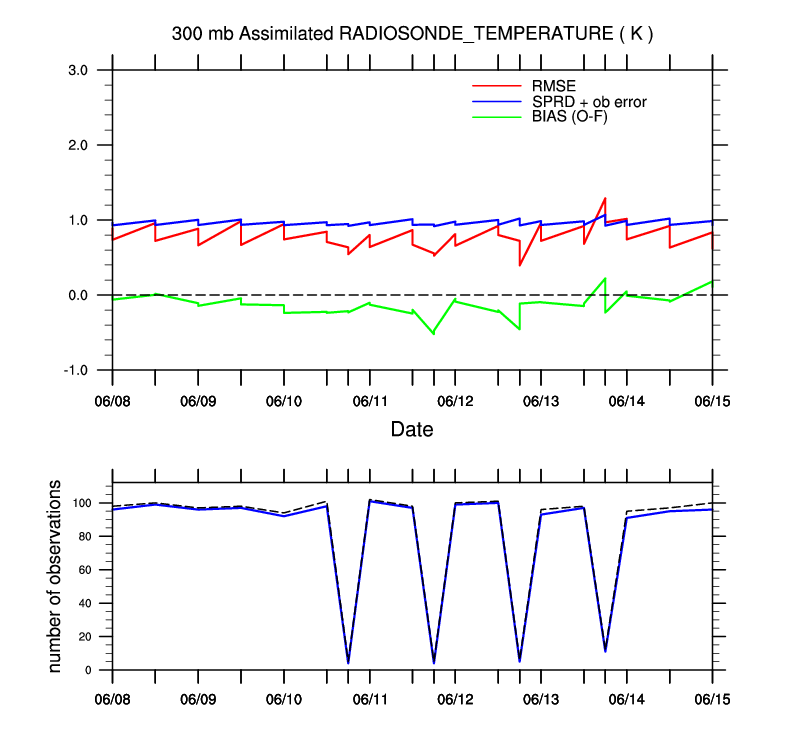
RSonde time series, Temp.:
850
700
500
300
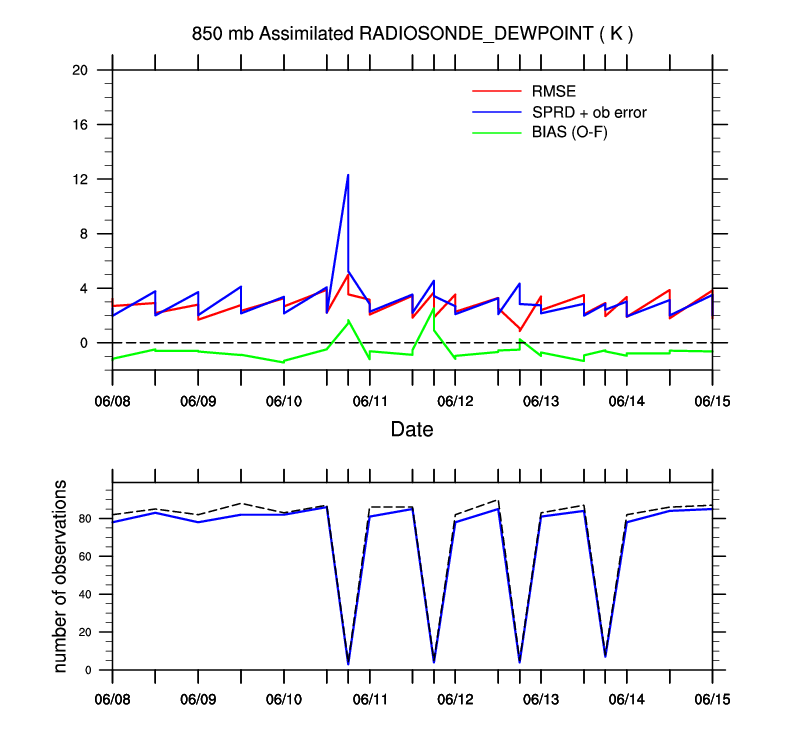
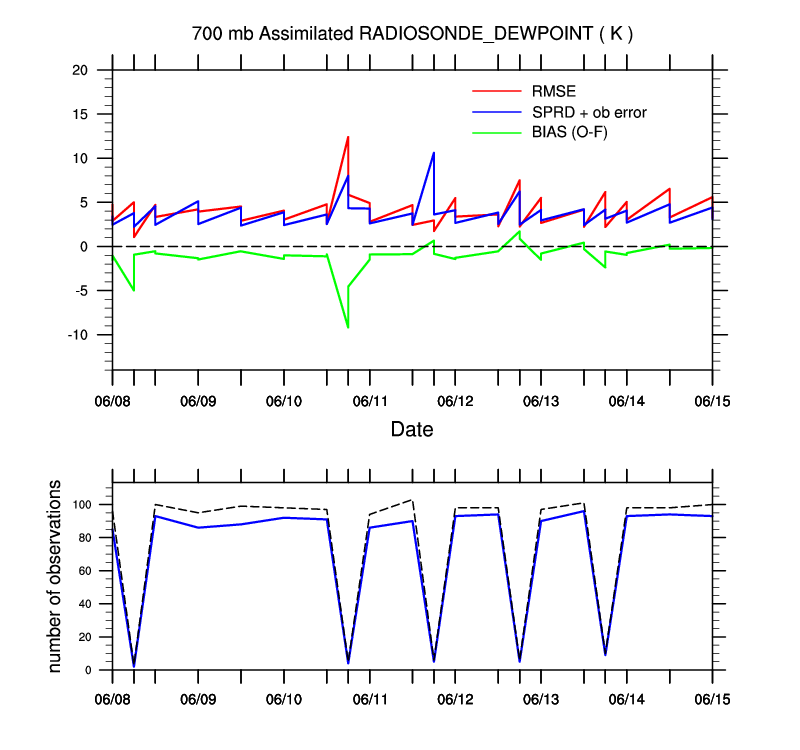
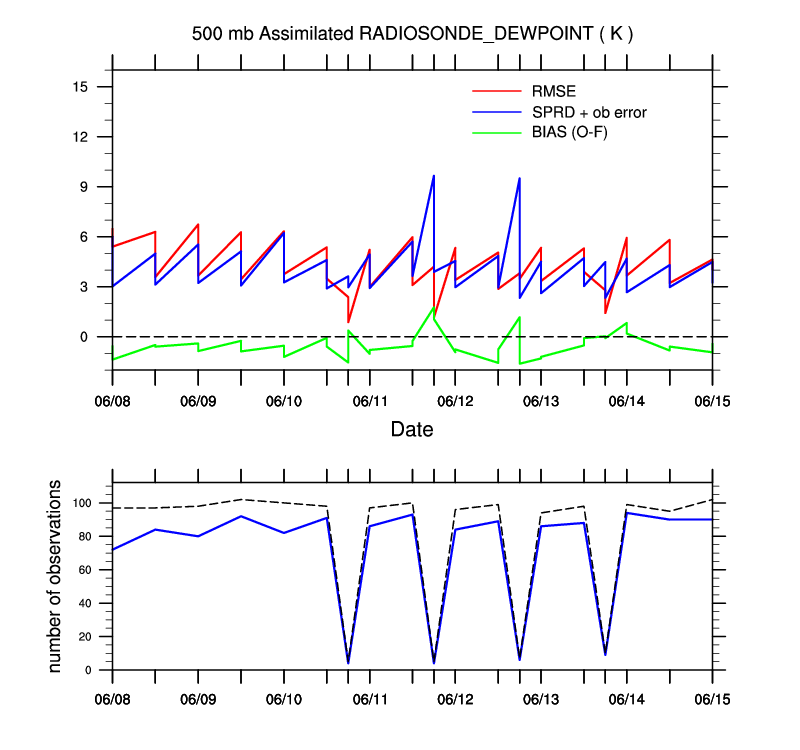
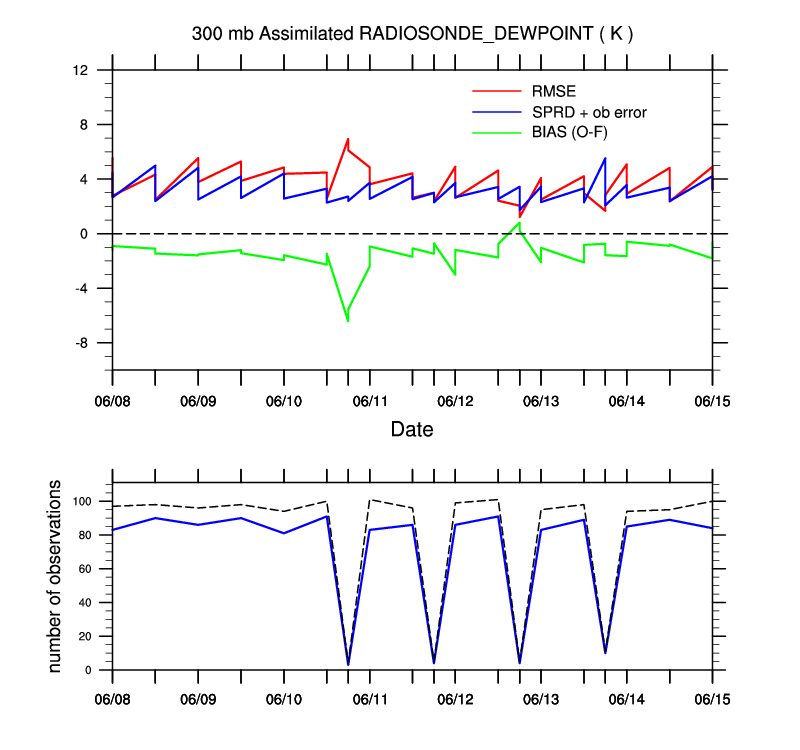
RSonde time series, Dwpt.:
850
700
500
300
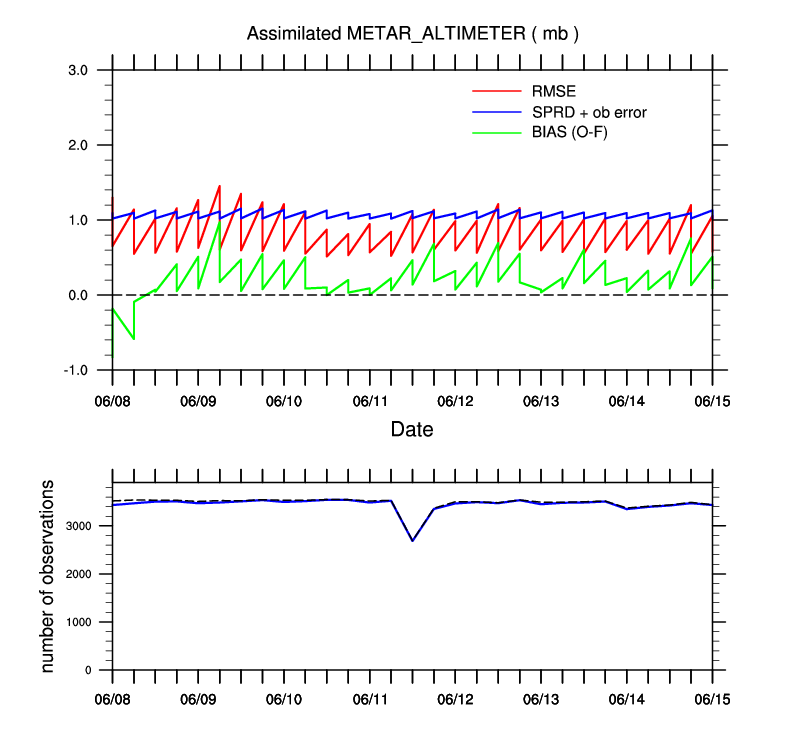
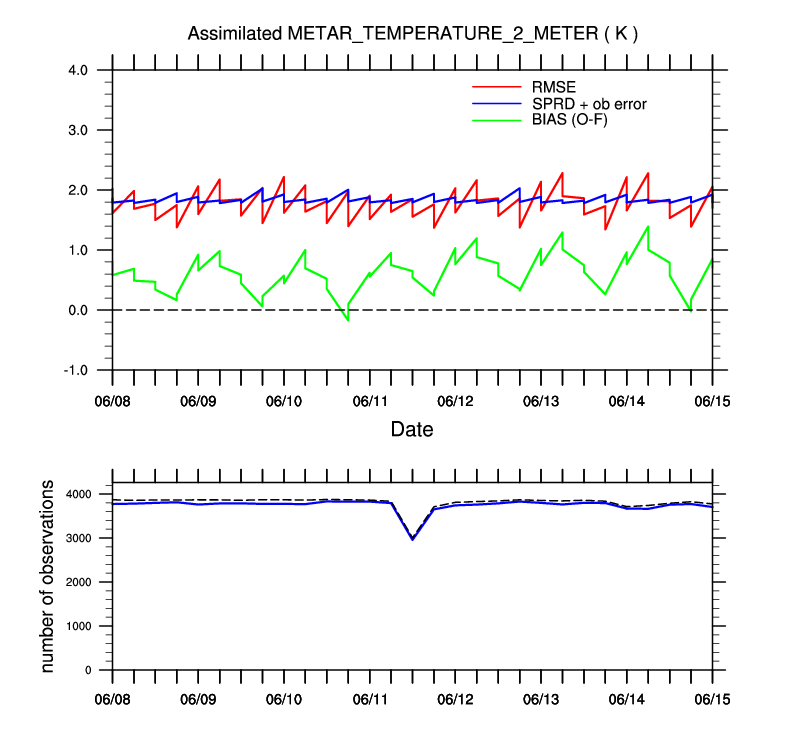
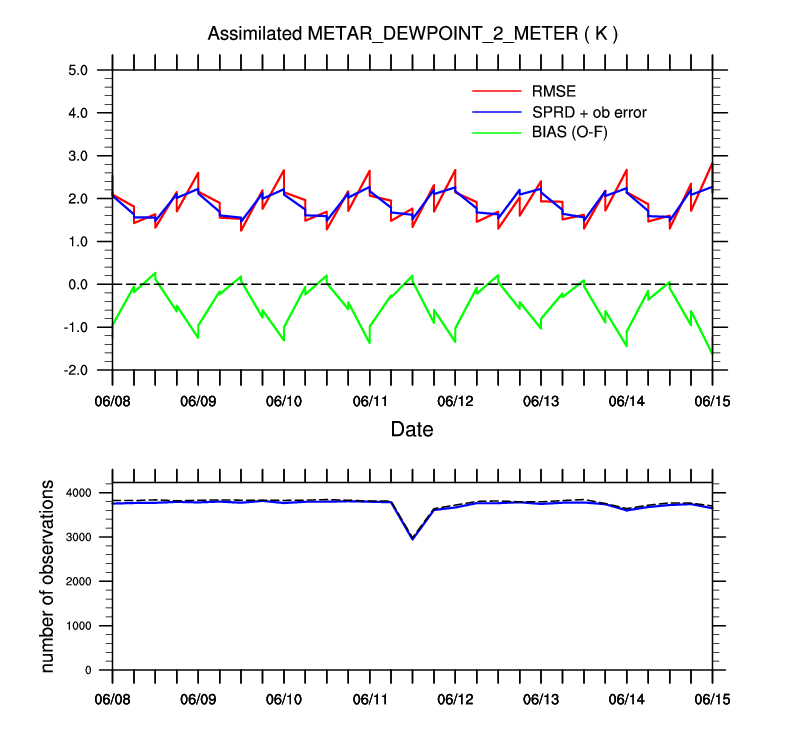
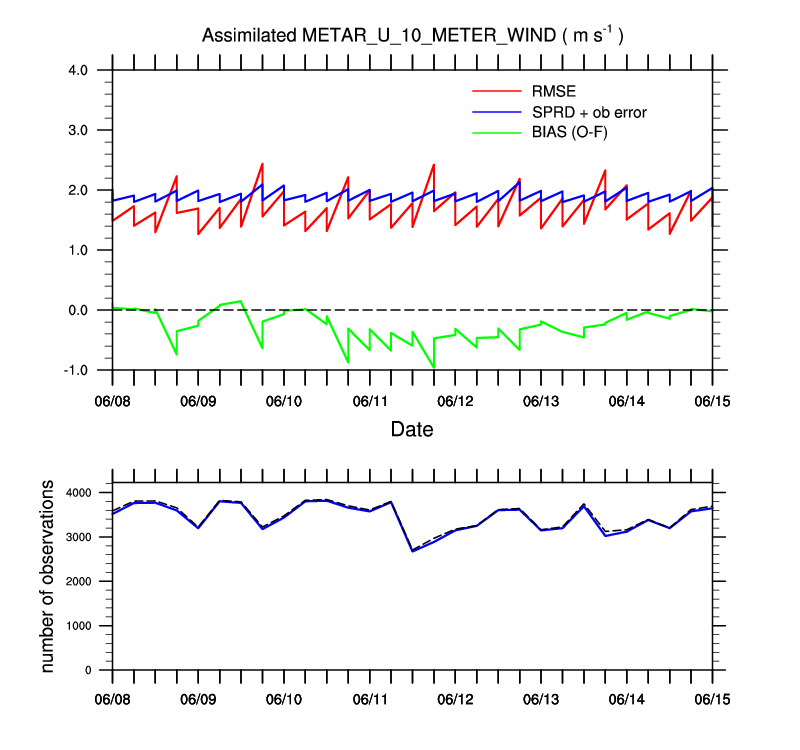
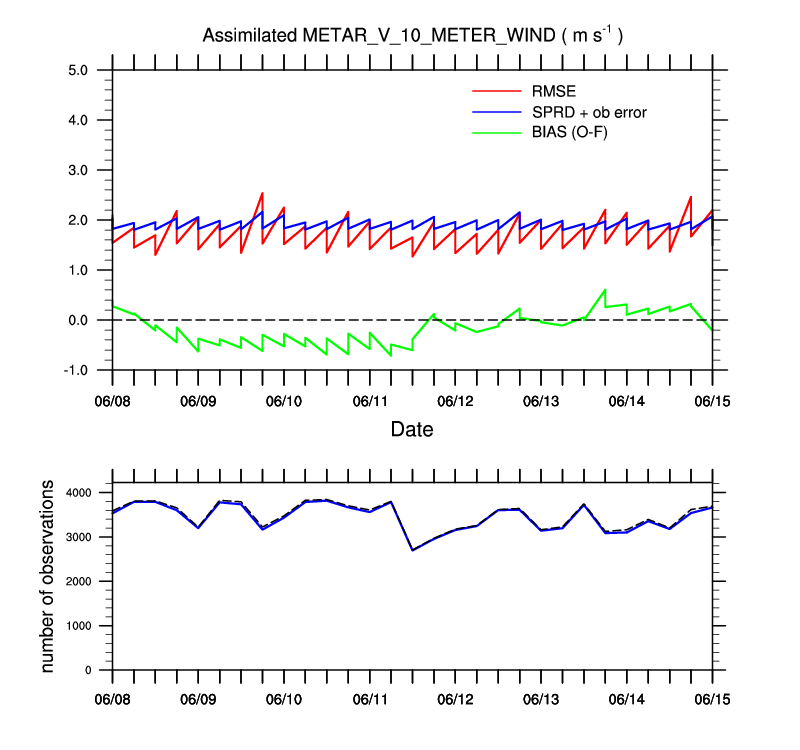
METAR time series:
ALTI
TEMP
DWPT
U10M
V10M
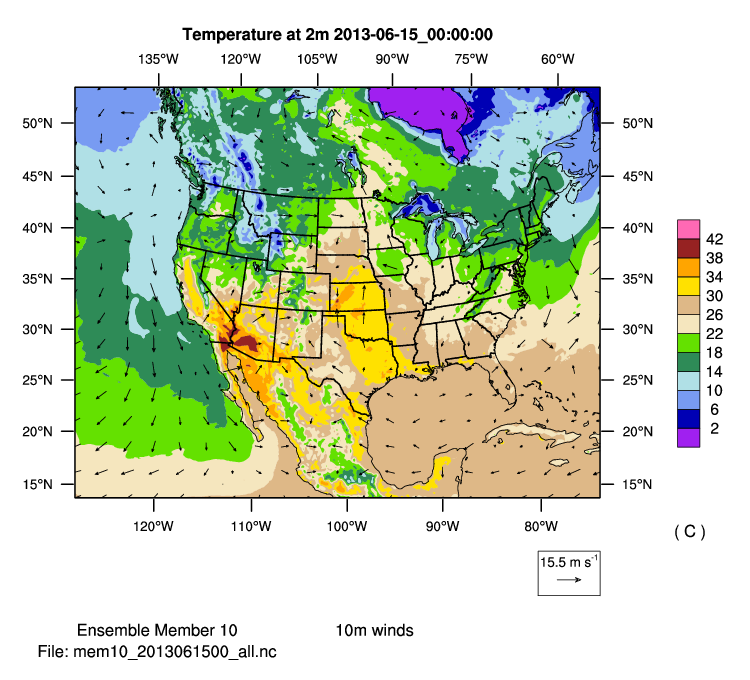
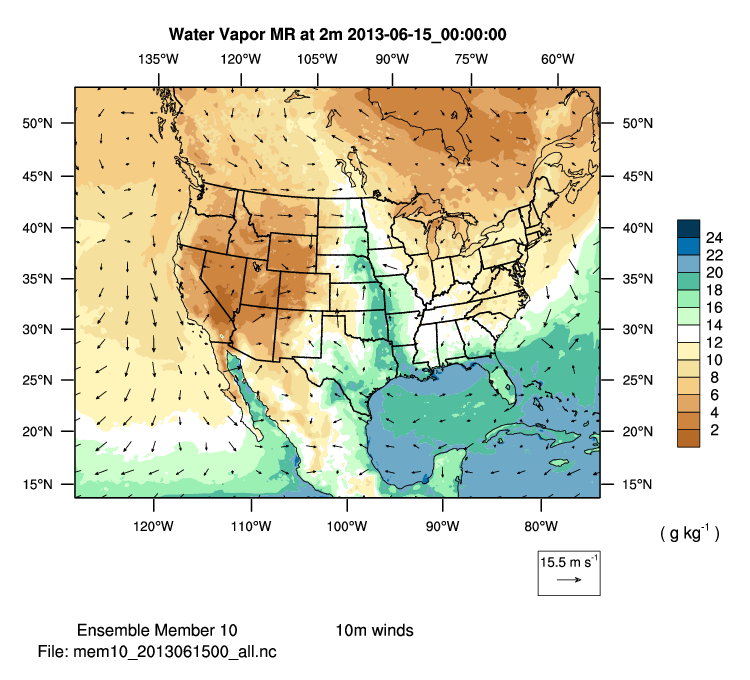
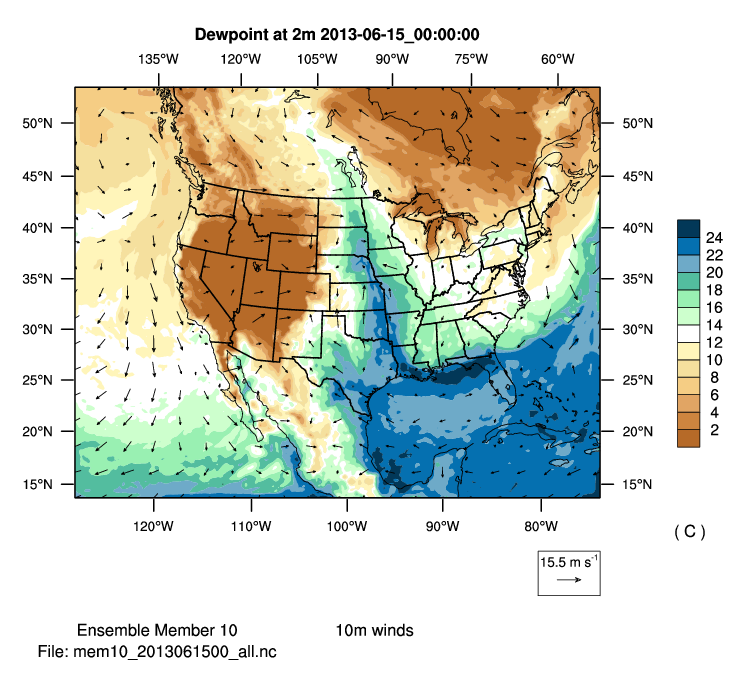
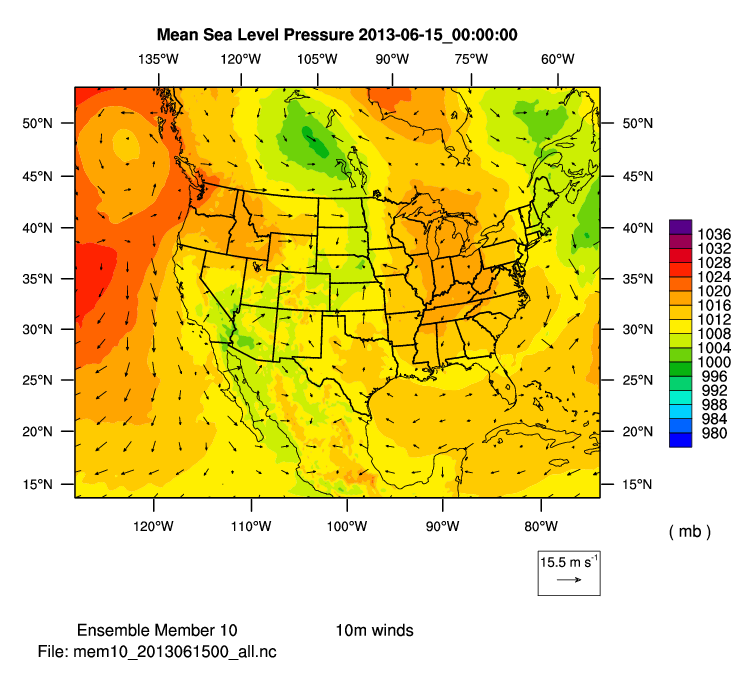
Closest Member Analysis
2M Temperature
2M Water Vapor
2M Dewpoint
Mean Sea Lvl Press
Precipitable Water
Sim. Reflectivity
ML CAPE
ML CIN
0-3km SRH
Fields on constant pressure surfaces (mb):
Geopotential Height:
850
700
500
300
250
Isotachs:
850
700
500
300
250
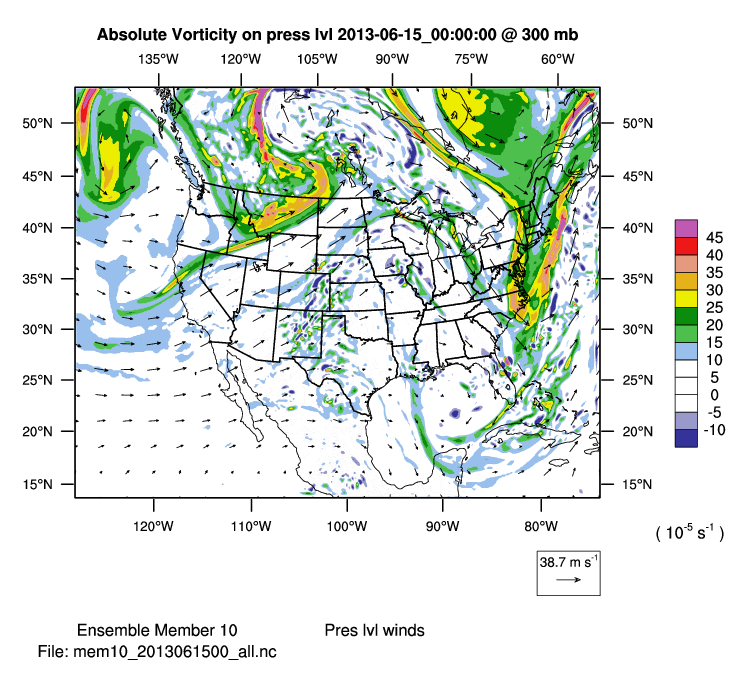
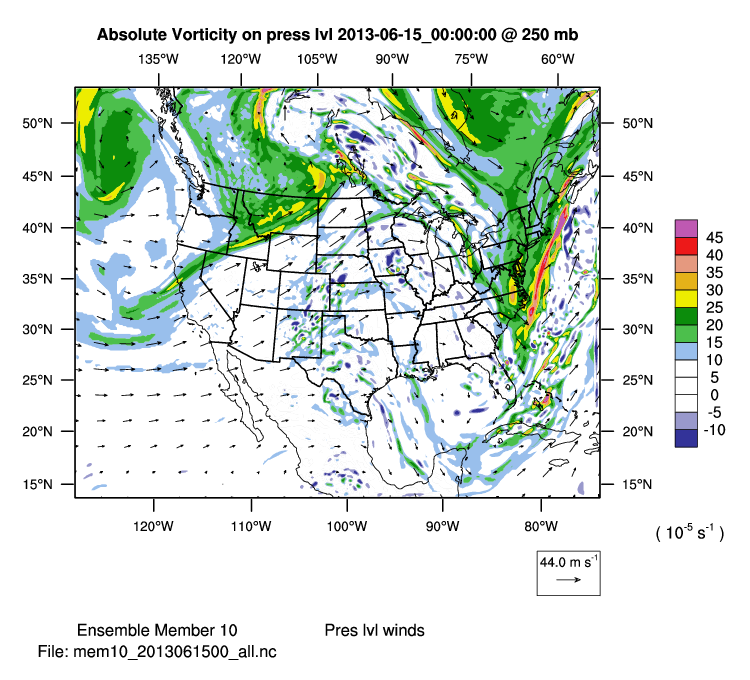
Abs. Vorticity:
850
700
500
300
250
Temperature:
850
700
500
300
250
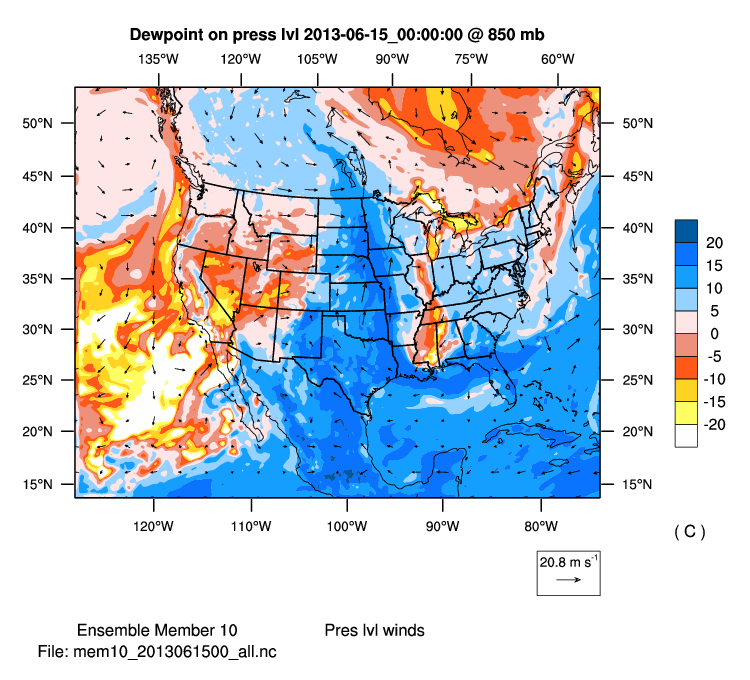
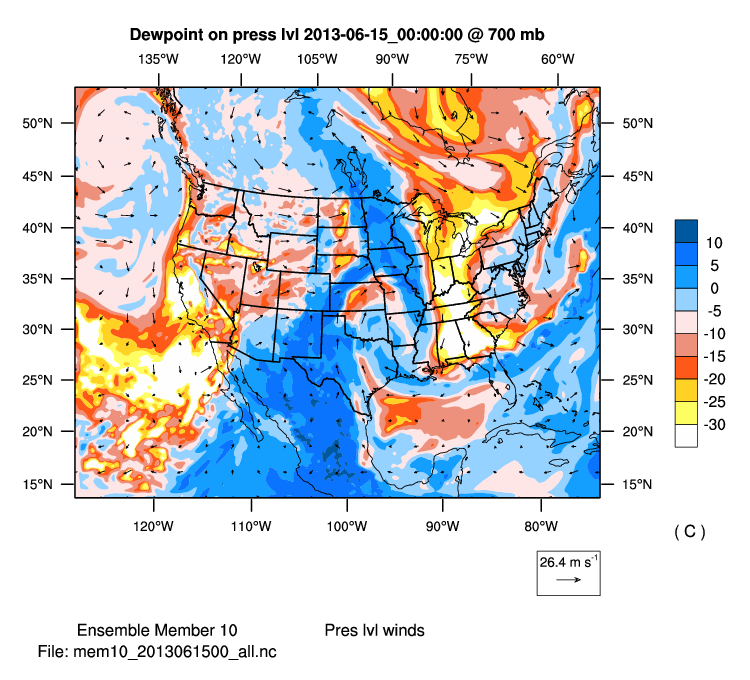
Dewpoint:
850
700
500
300
250
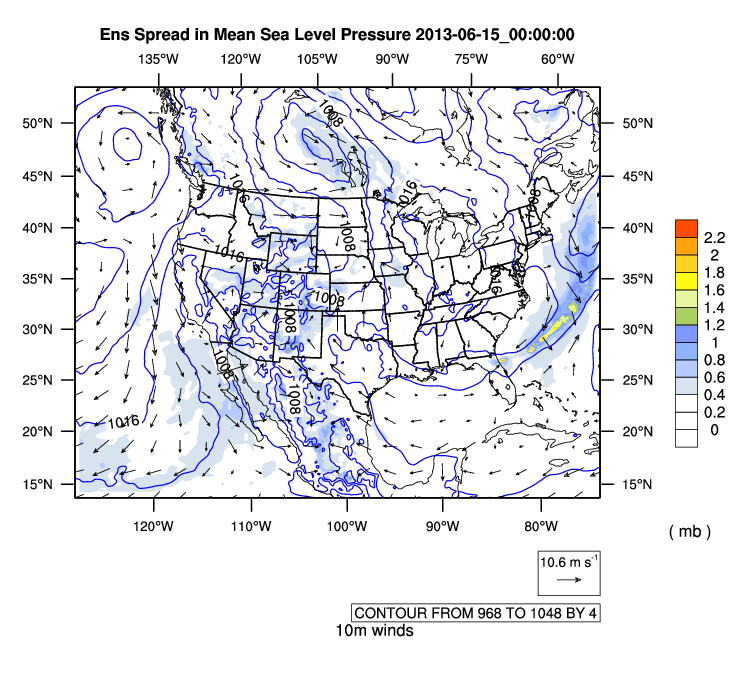
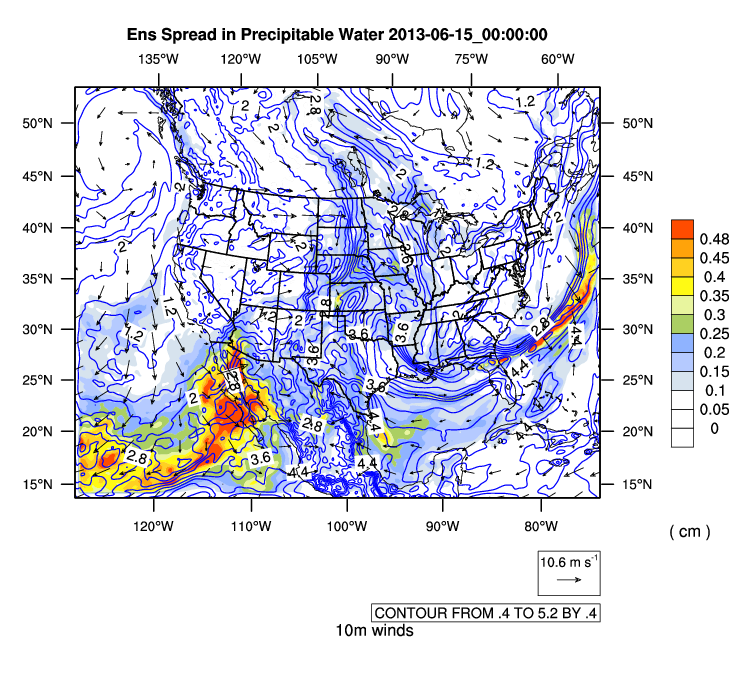
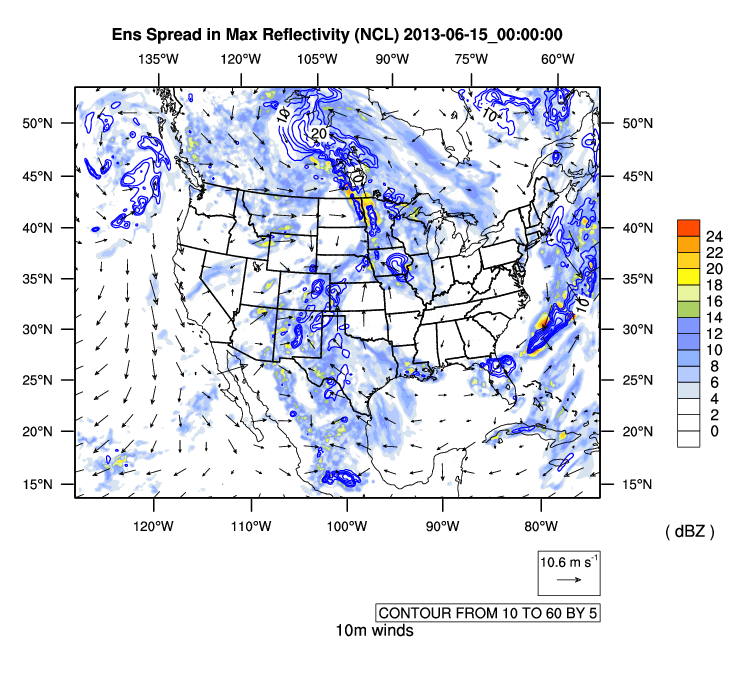
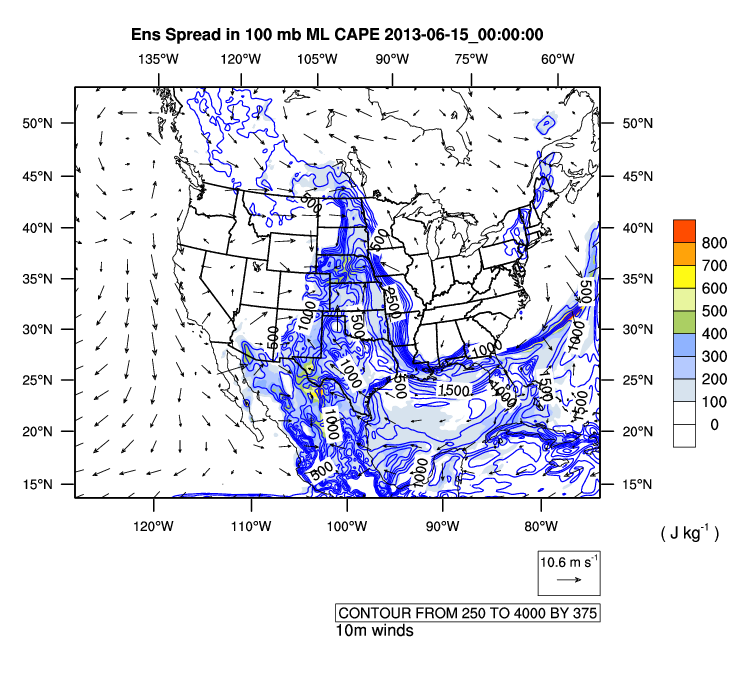
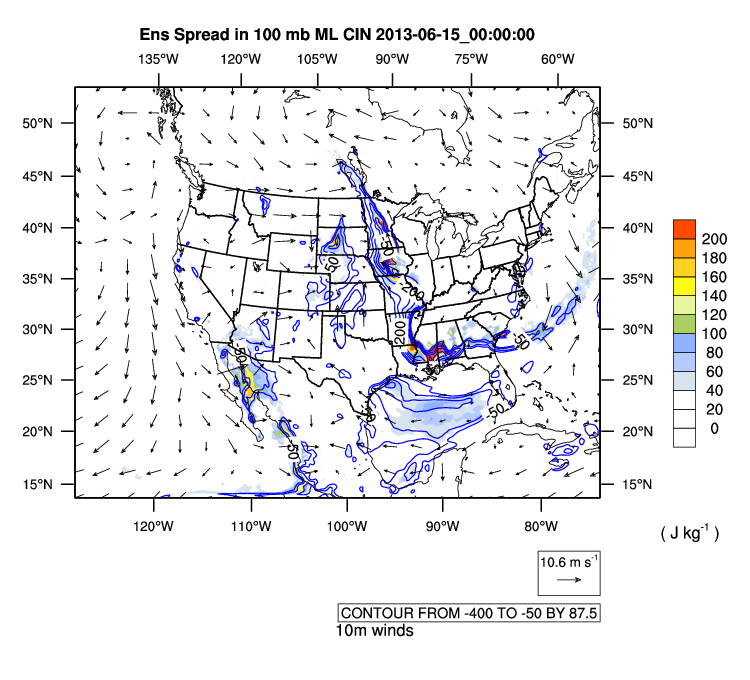
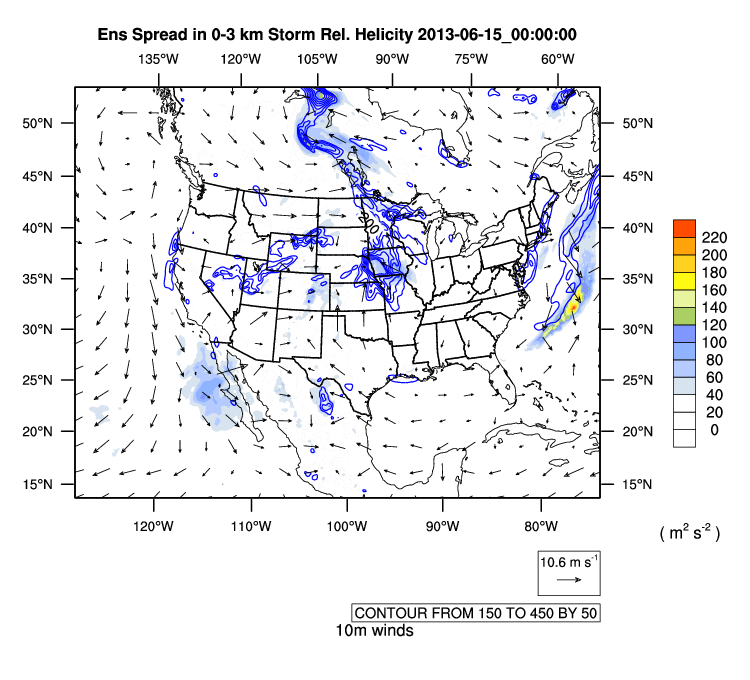
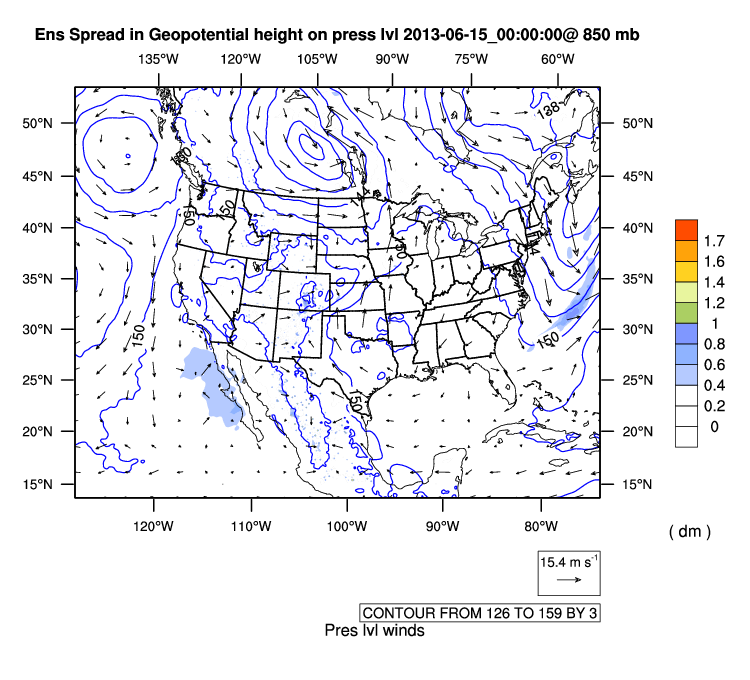
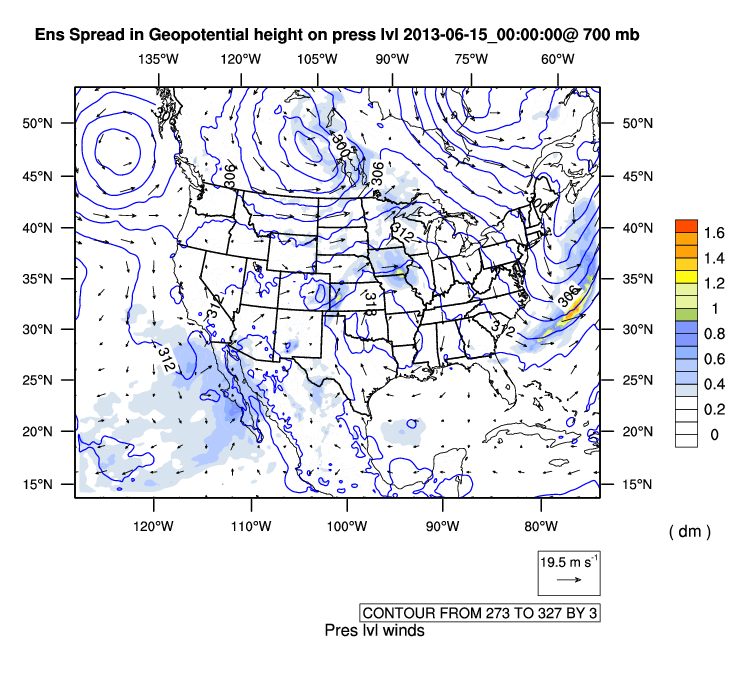
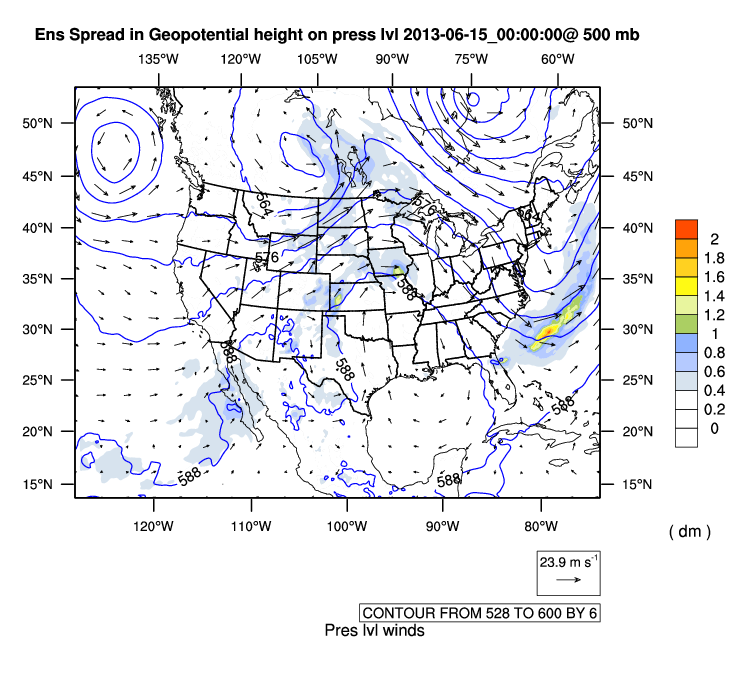
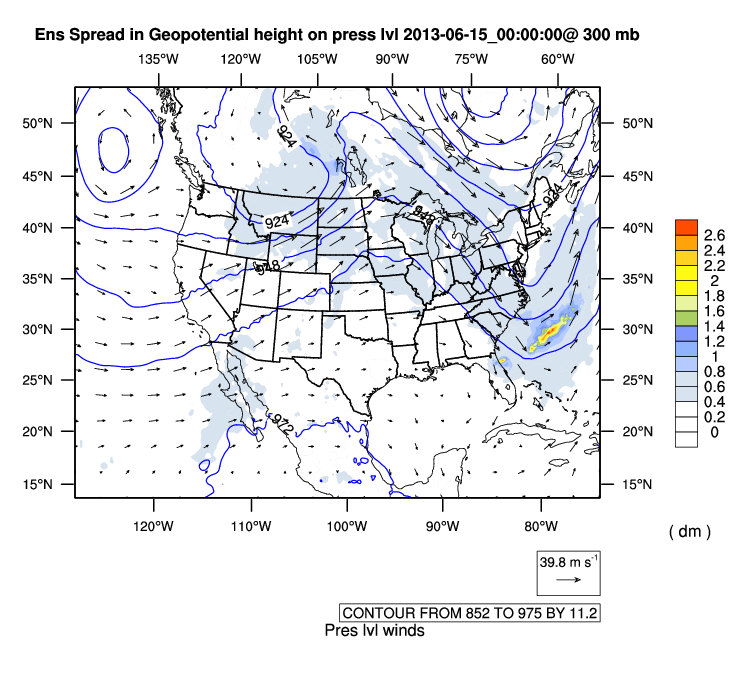
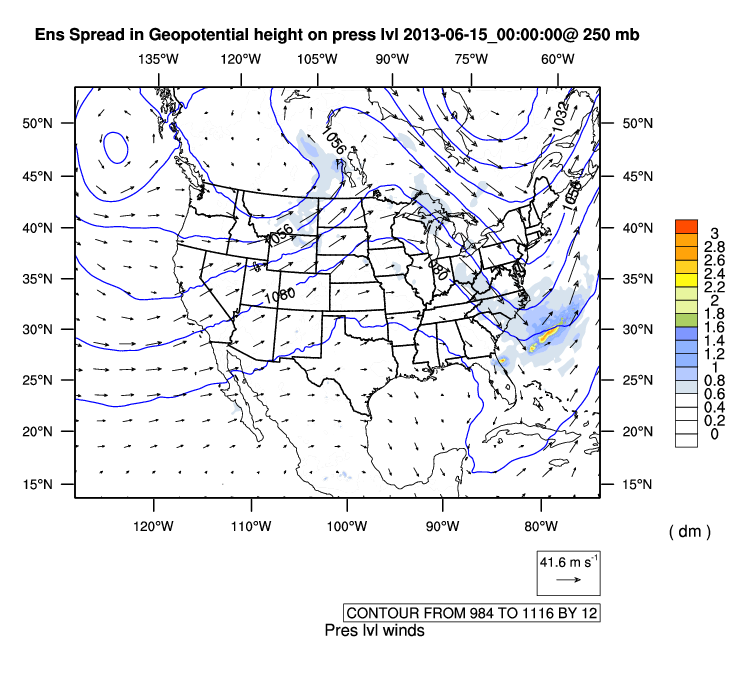
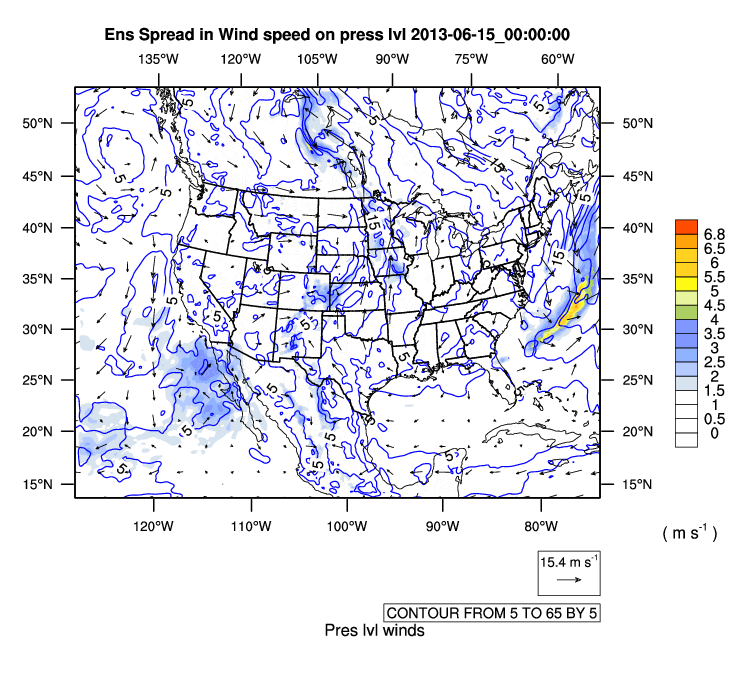
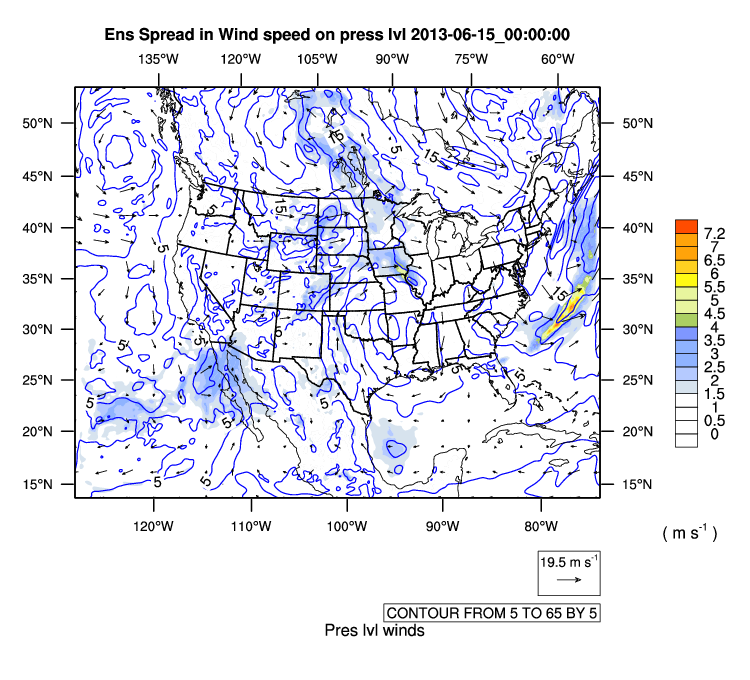
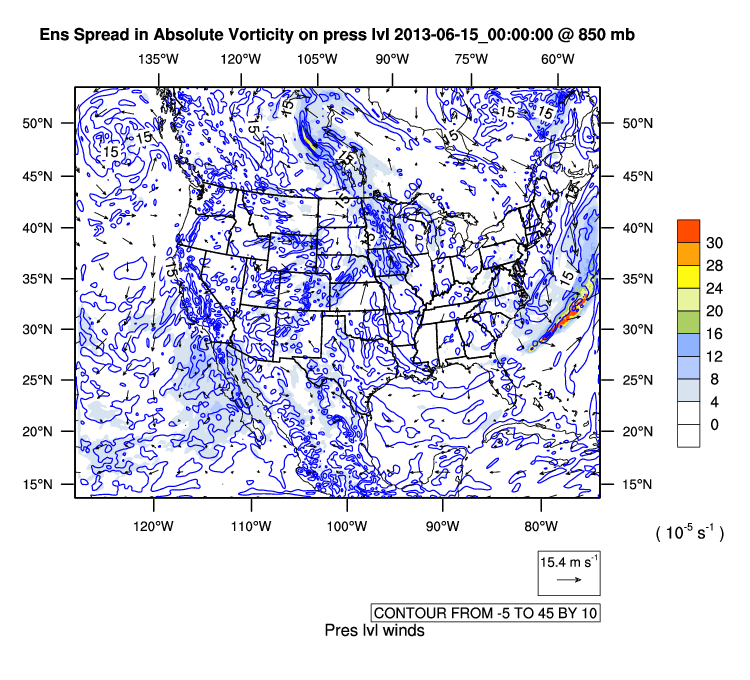
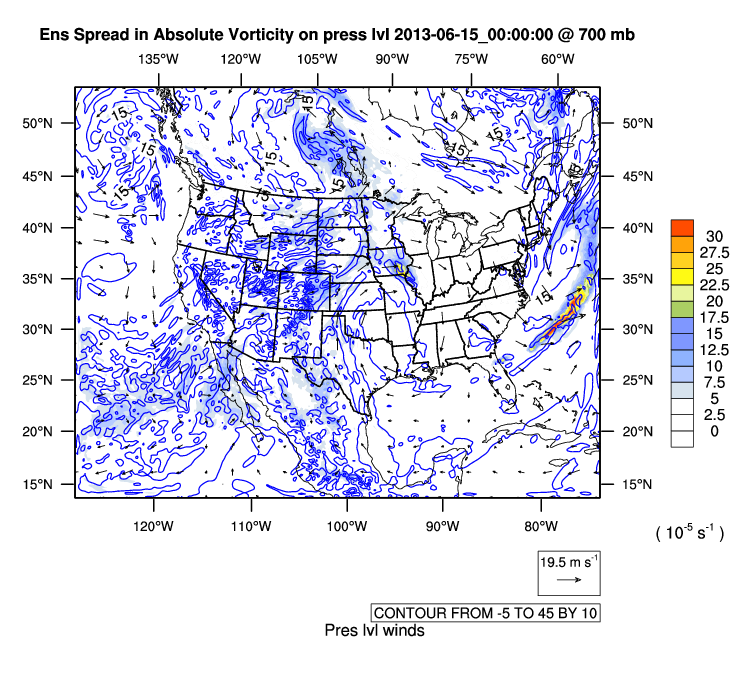
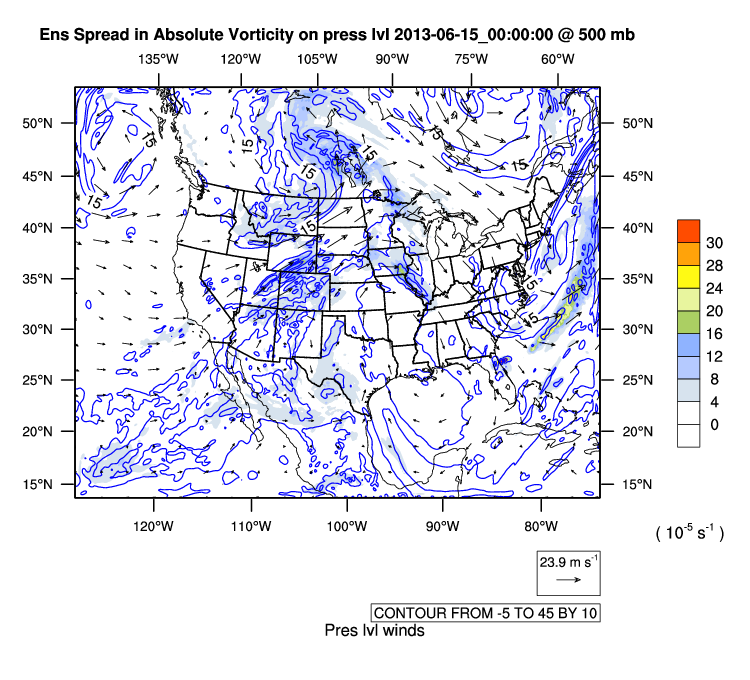
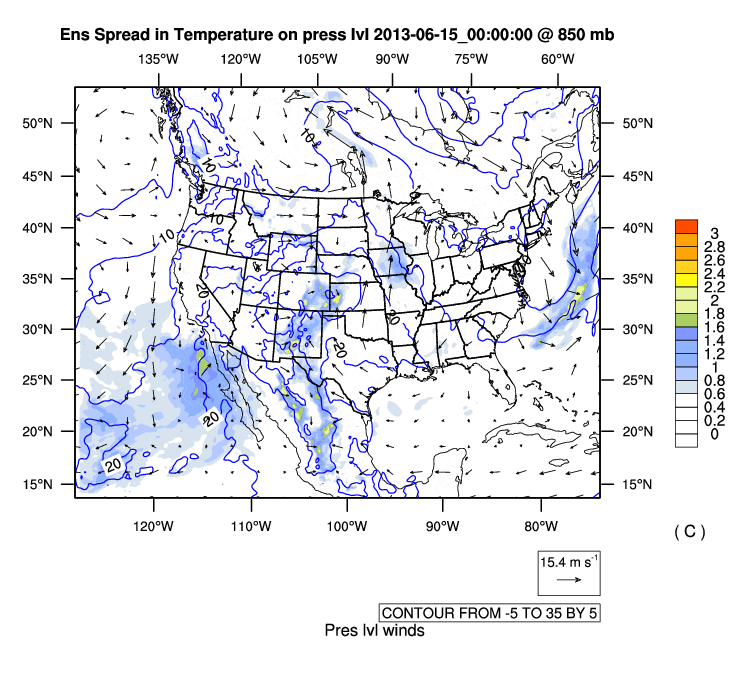
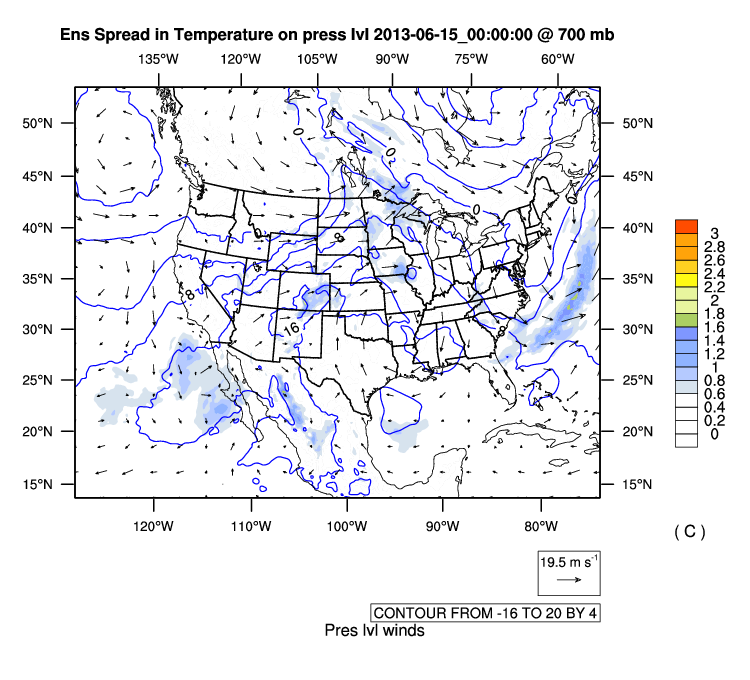
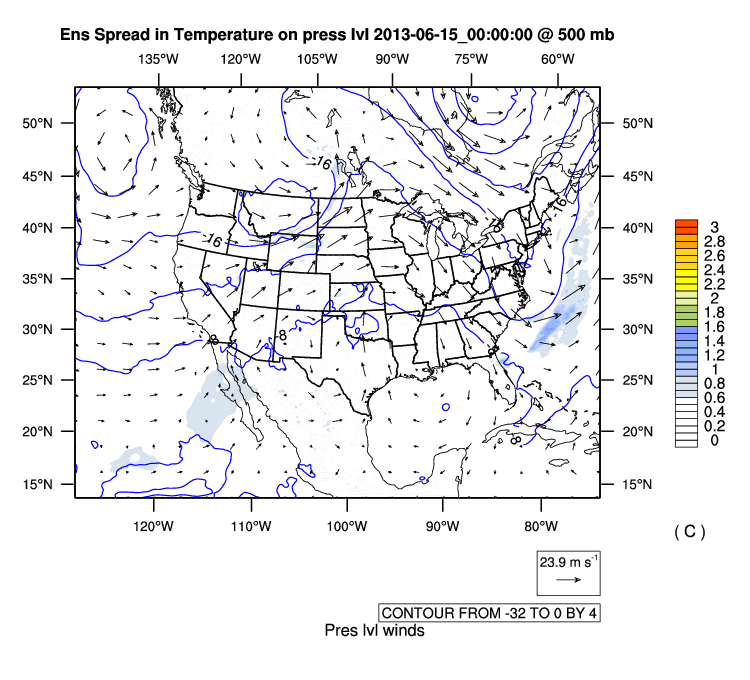
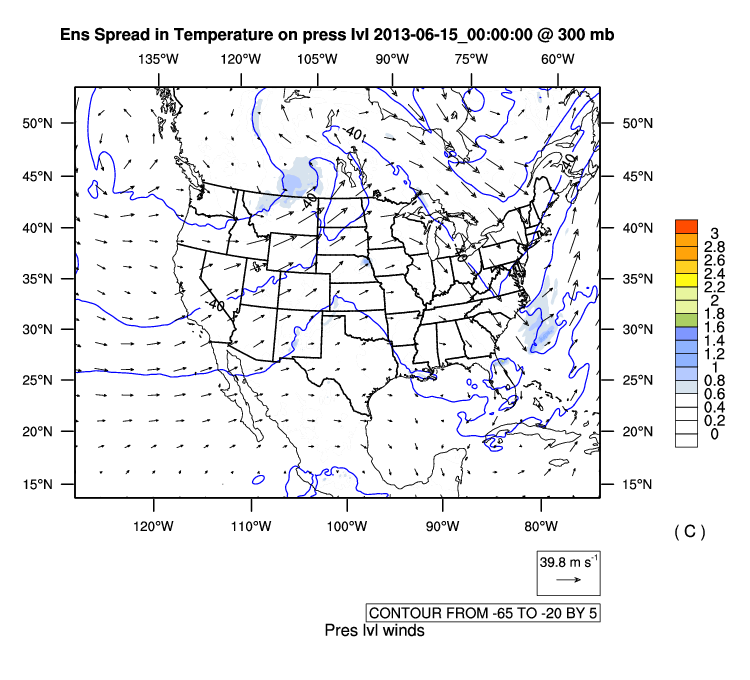
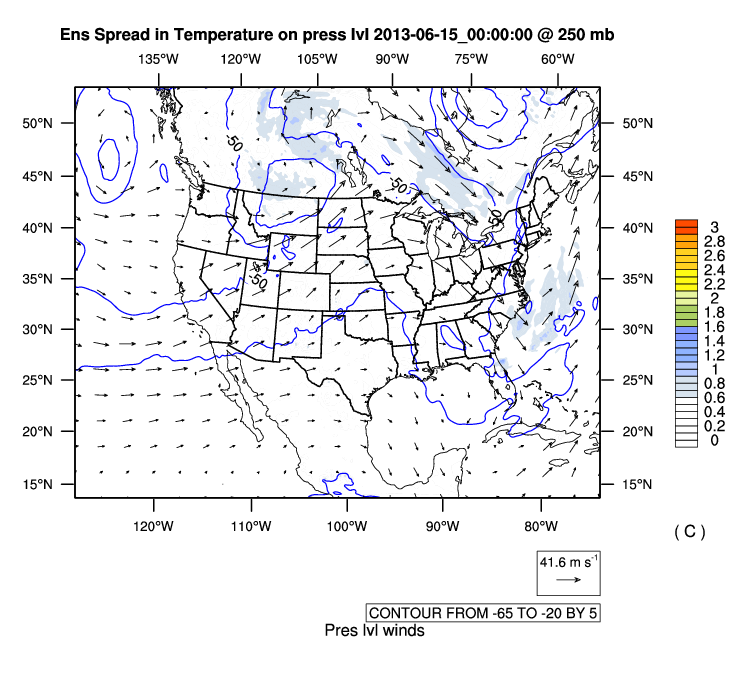
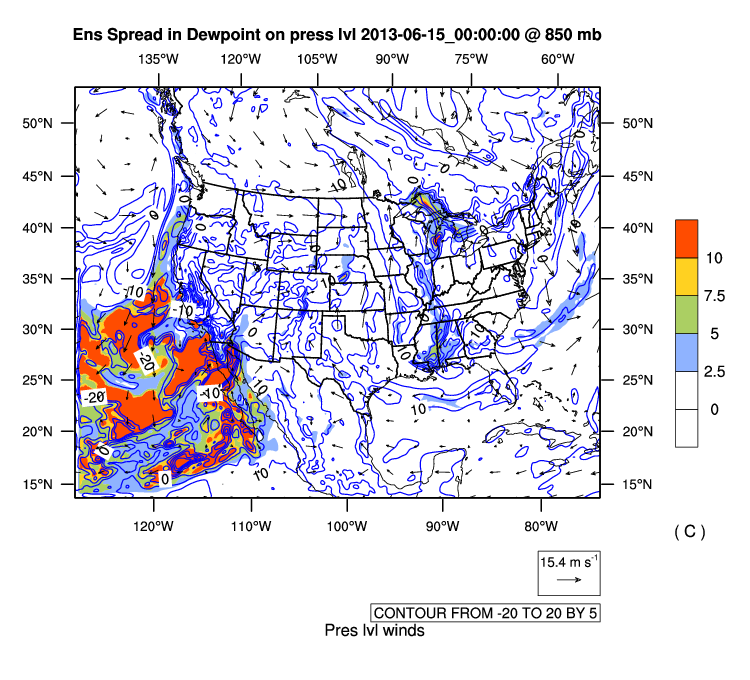
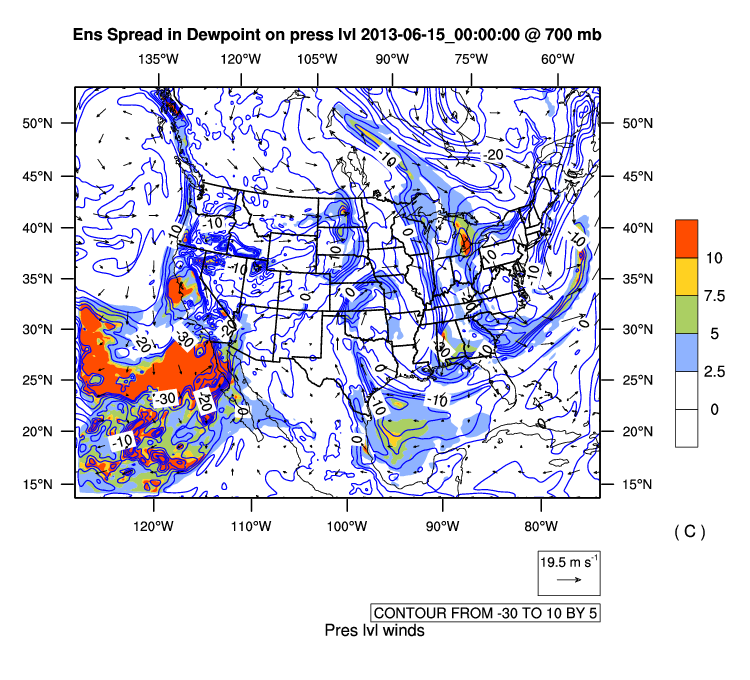
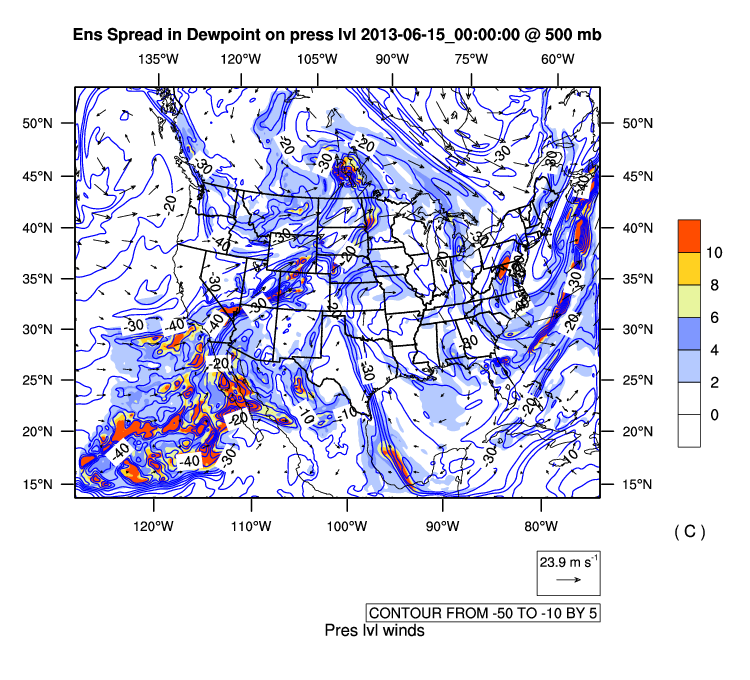
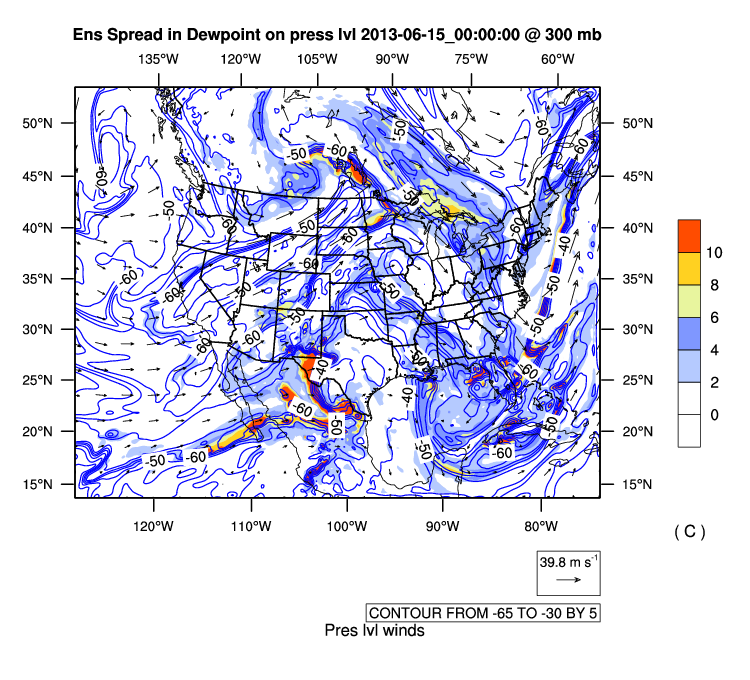
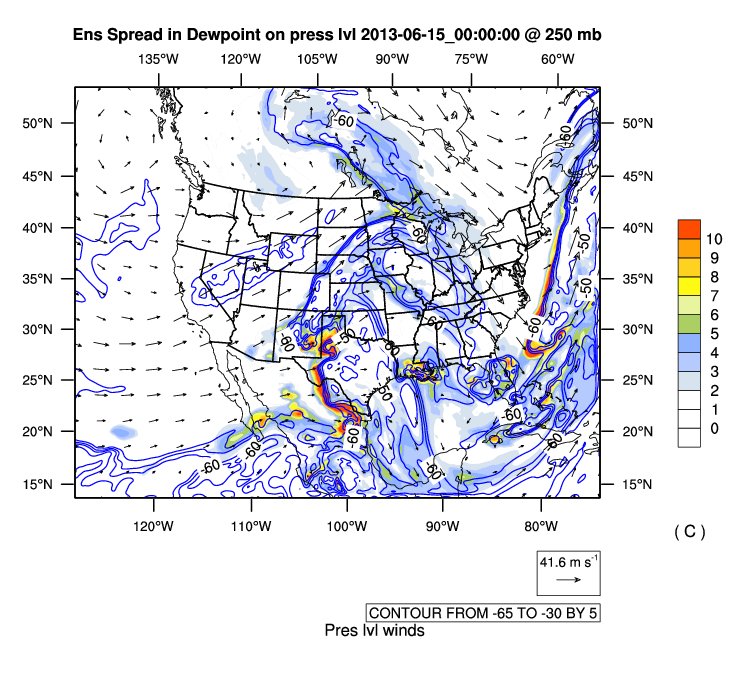
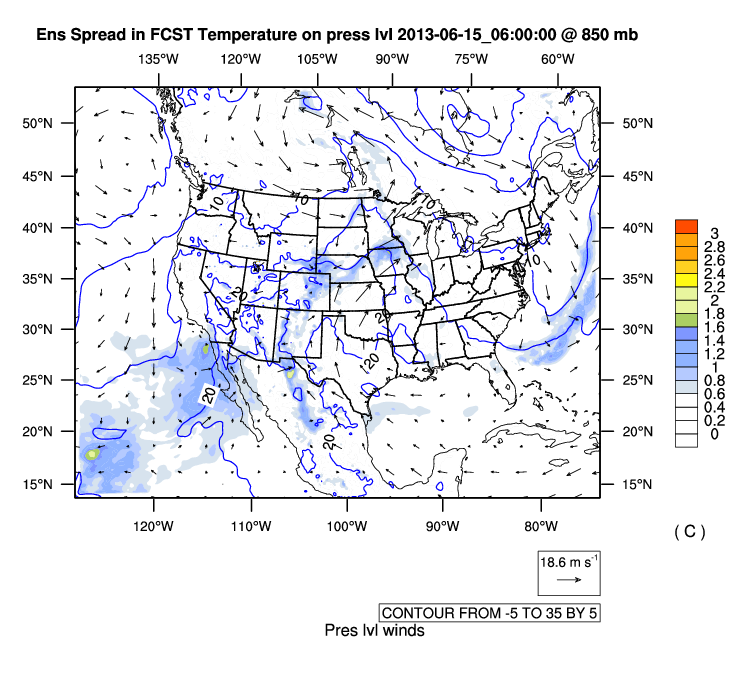
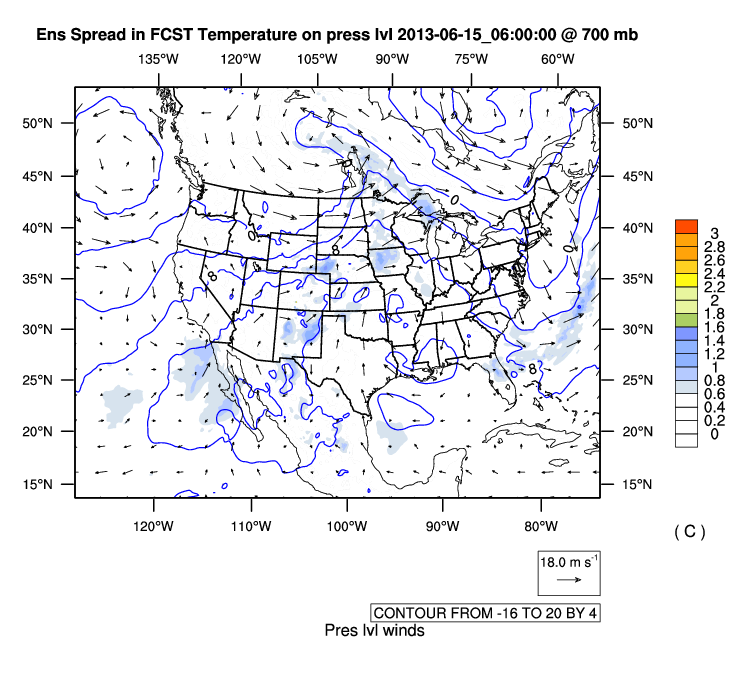
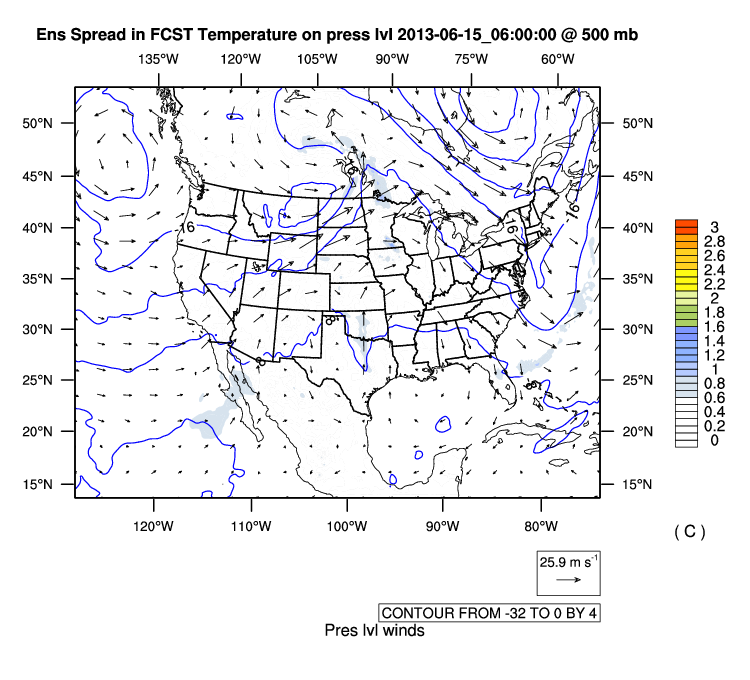
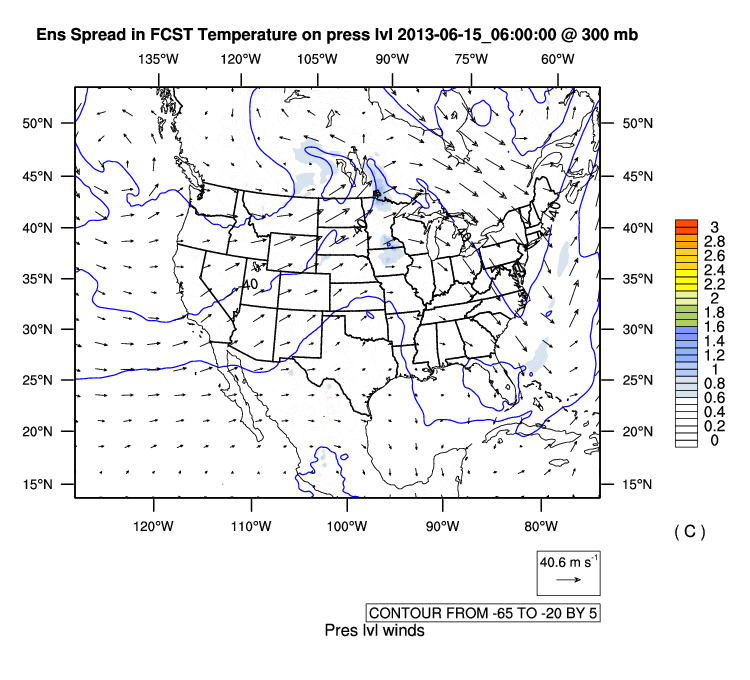
Ensemble Analysis Spread
2M Temperature
2M Water Vapor
2M Dewpoint
Mean Sea Lvl Press
Precipitable Water
Sim. Reflectivity
ML CAPE
ML CIN
0-3km SRH
Fields on constant pressure surfaces (mb):
Geopotential Height:
850
700
500
300
250
Isotachs:
850
700
500
300
250
Abs. Vorticity:
850
700
500
300
250
Temperature:
850
700
500
300
250
Dewpoint:
850
700
500
300
250
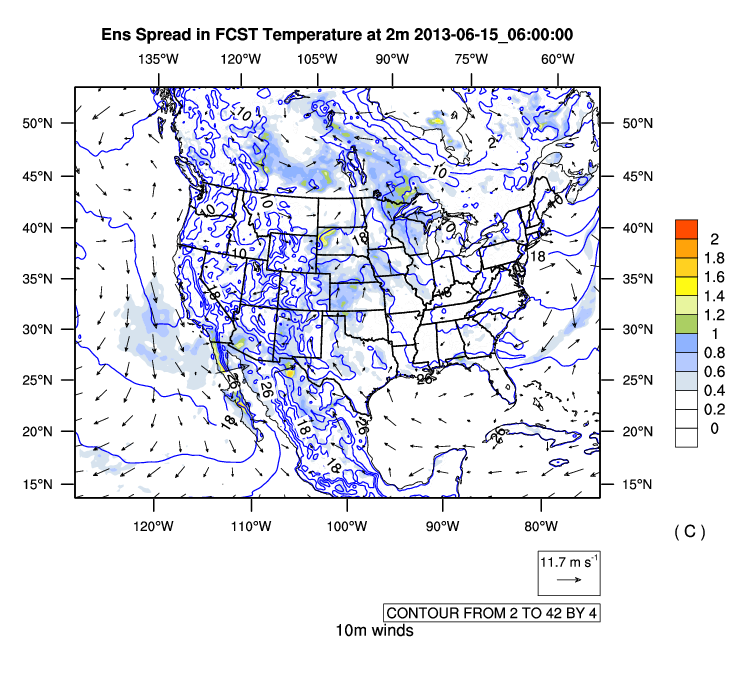
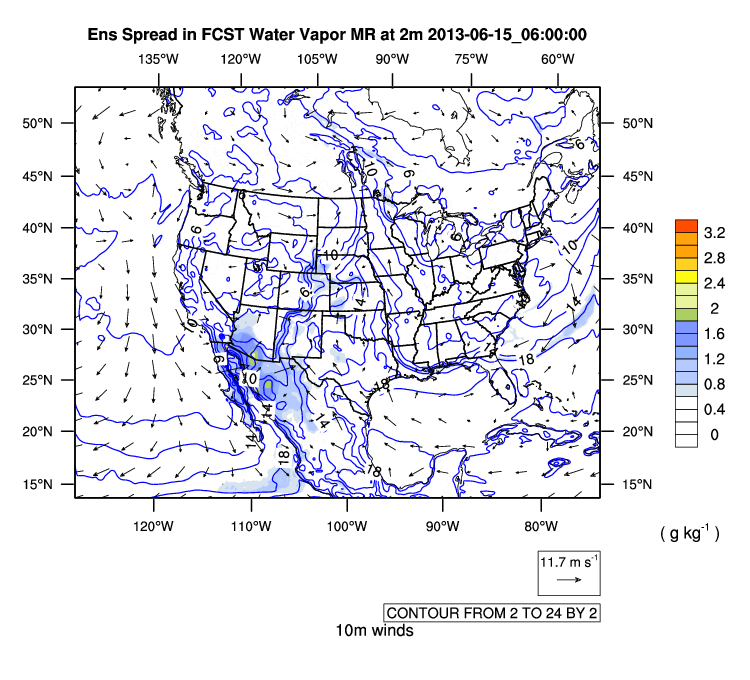
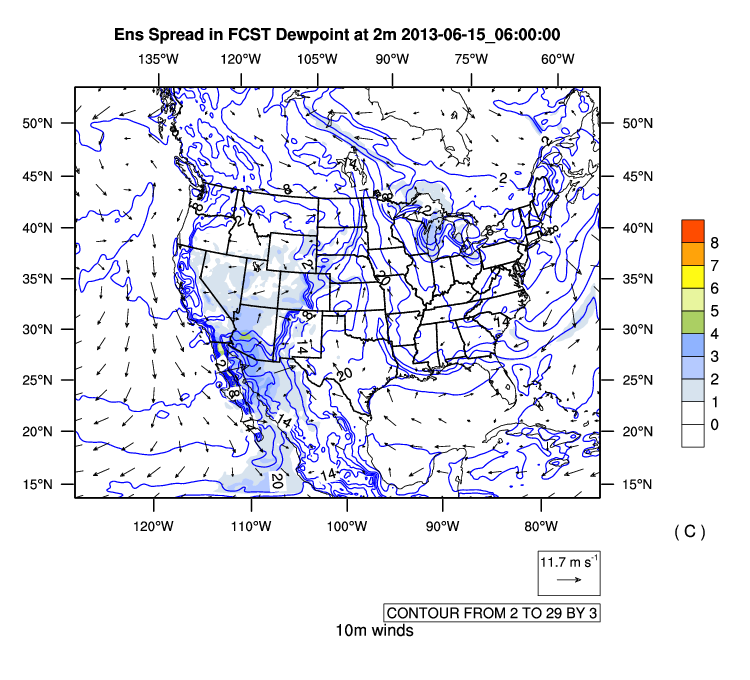
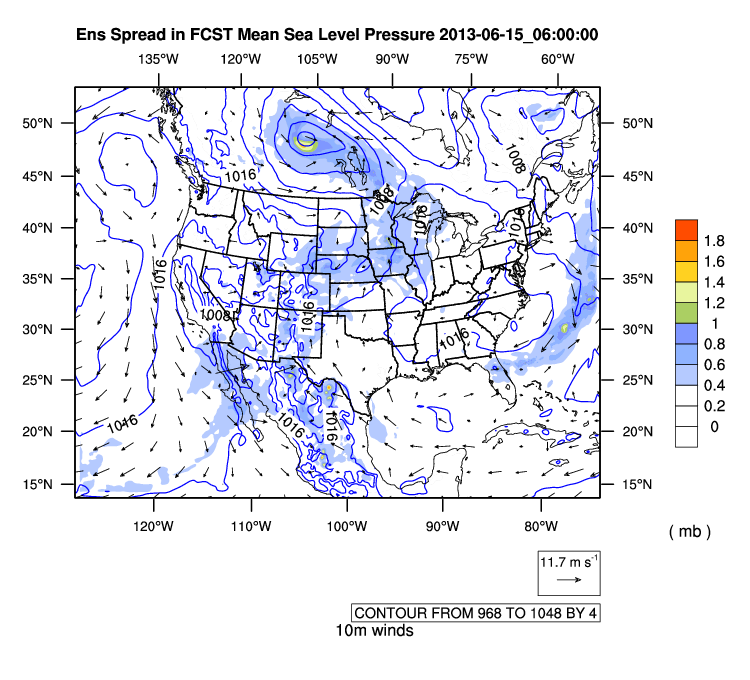
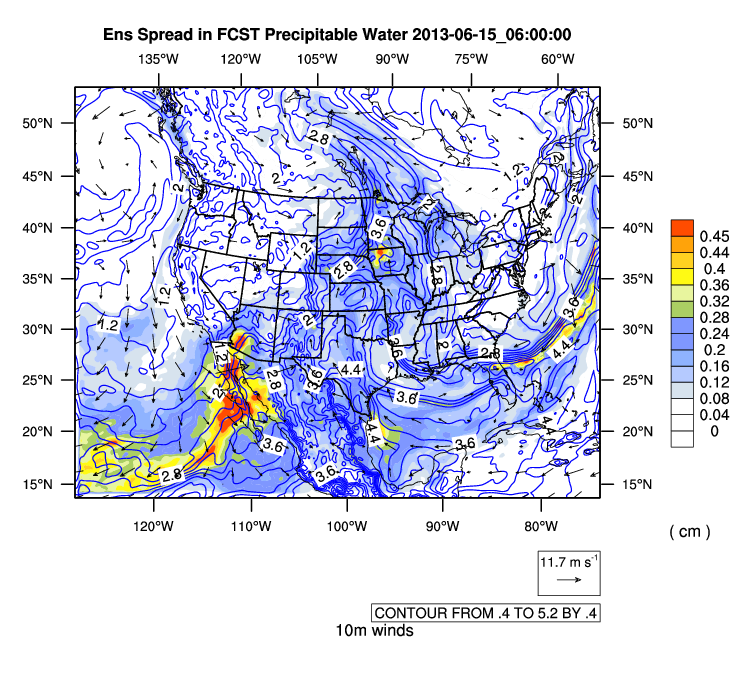
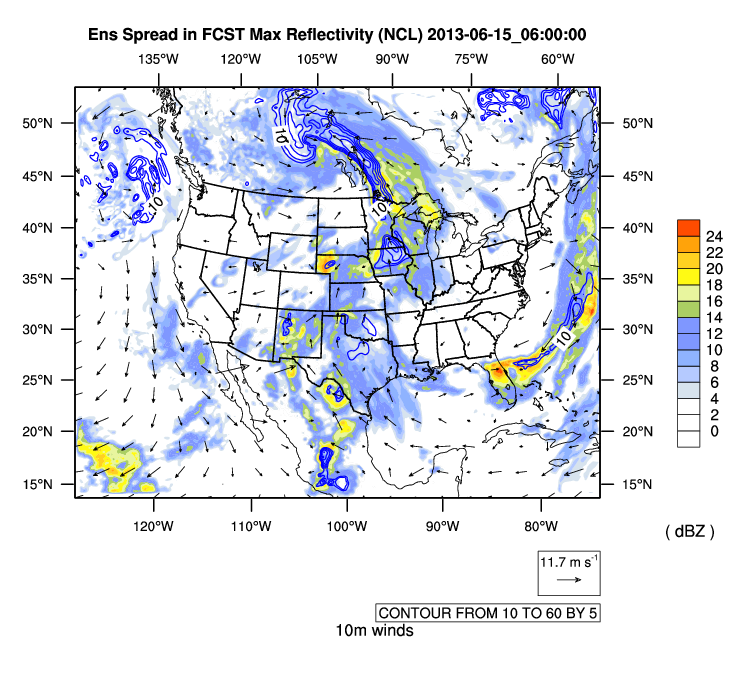
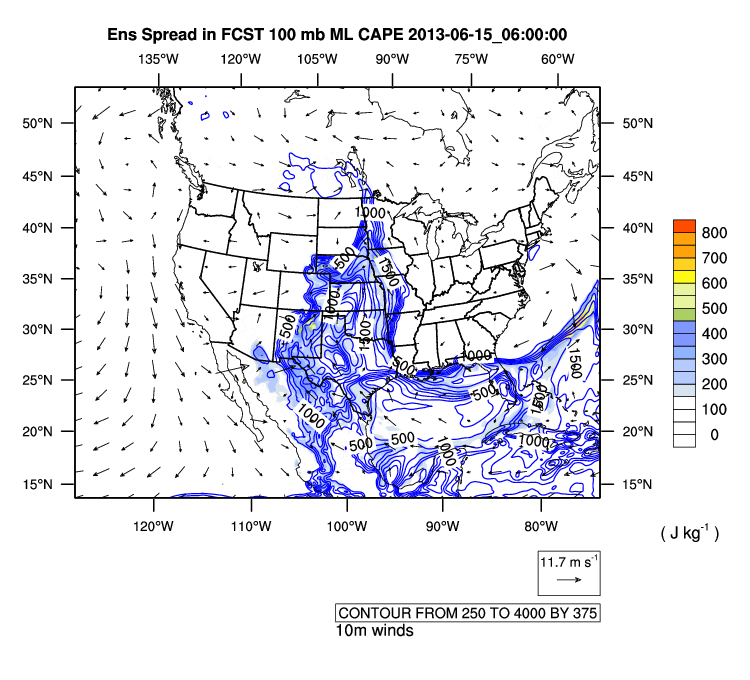
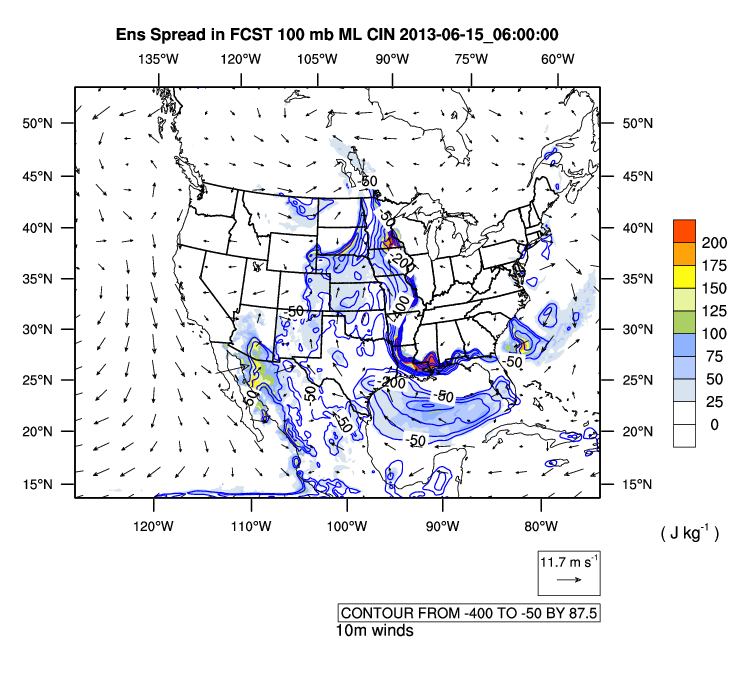
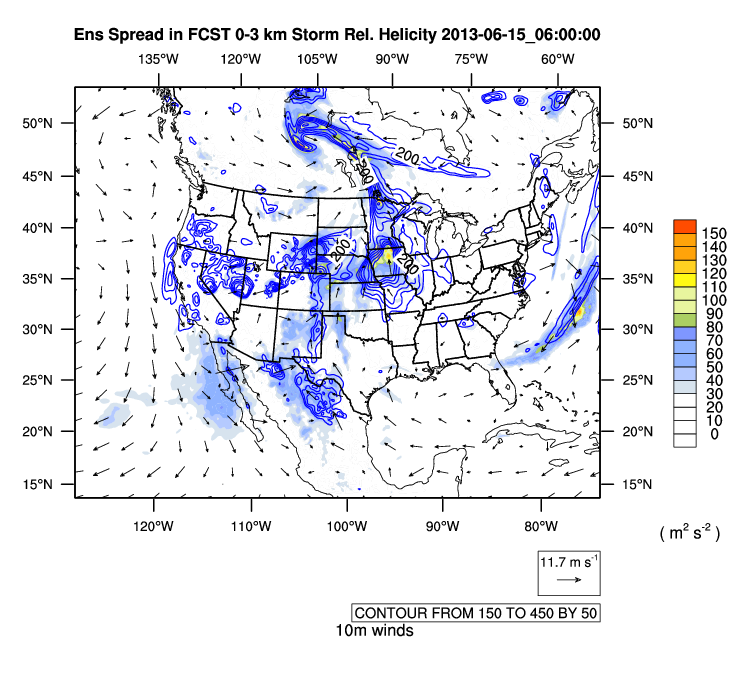
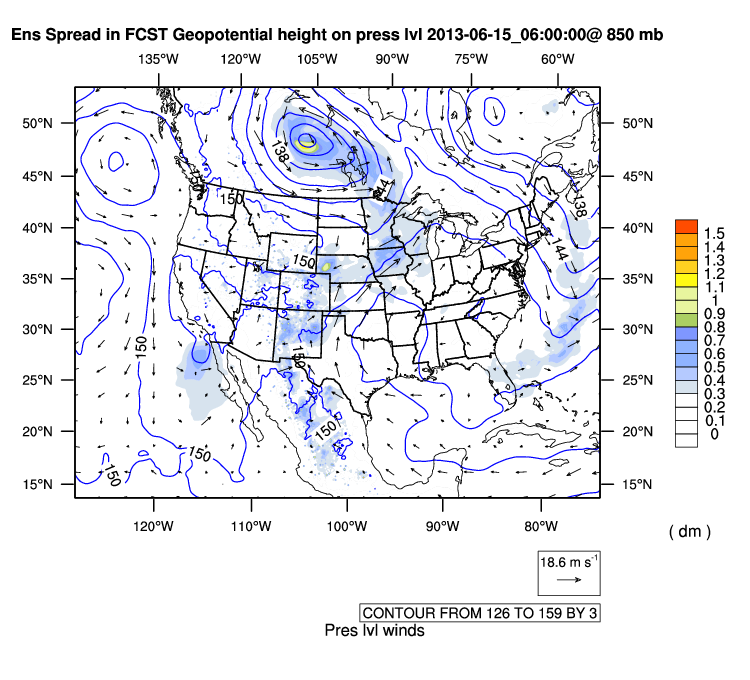
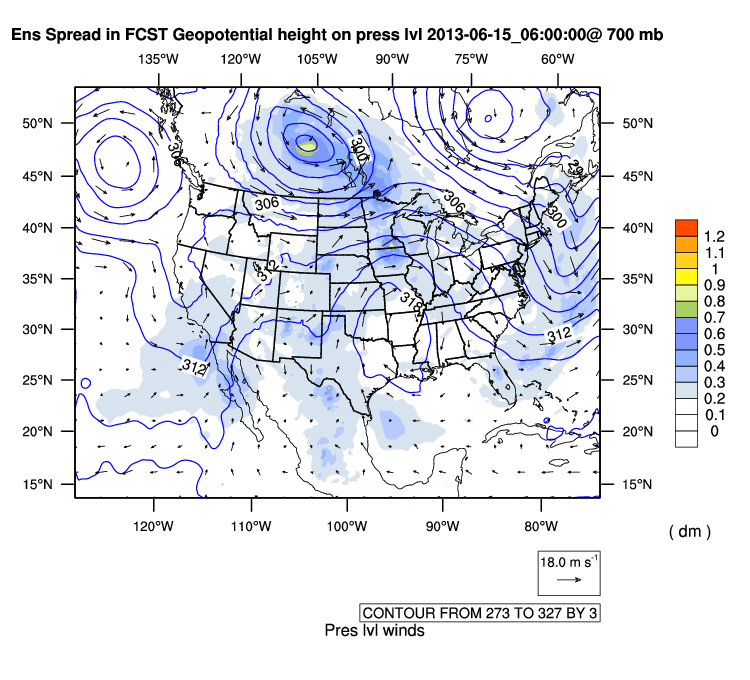
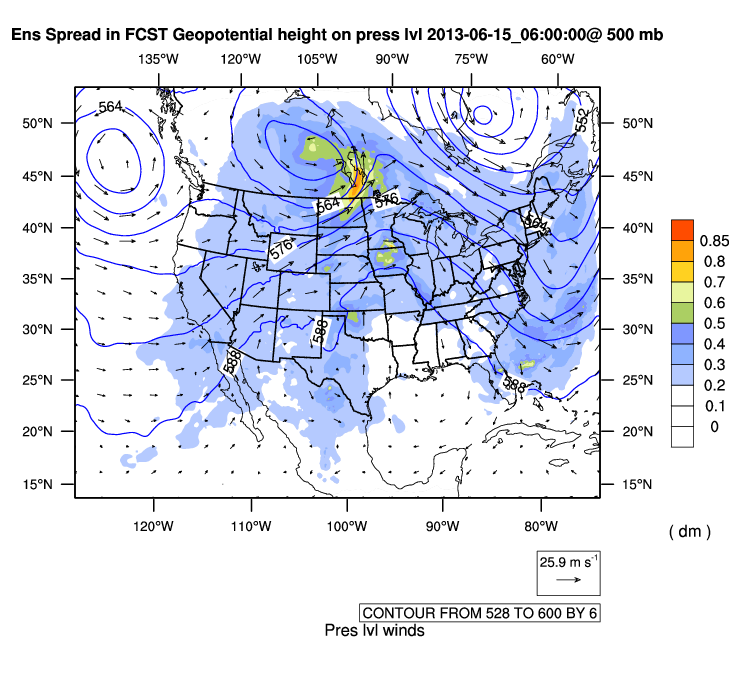
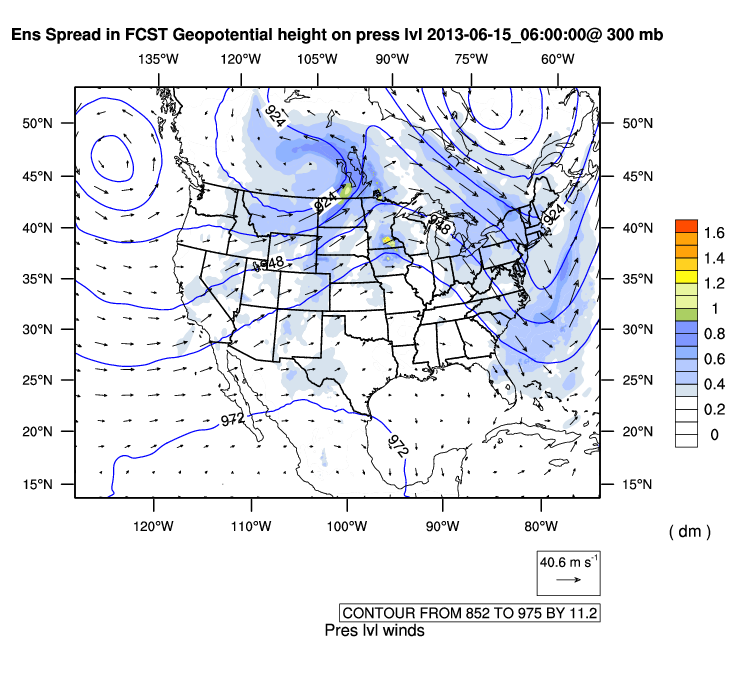
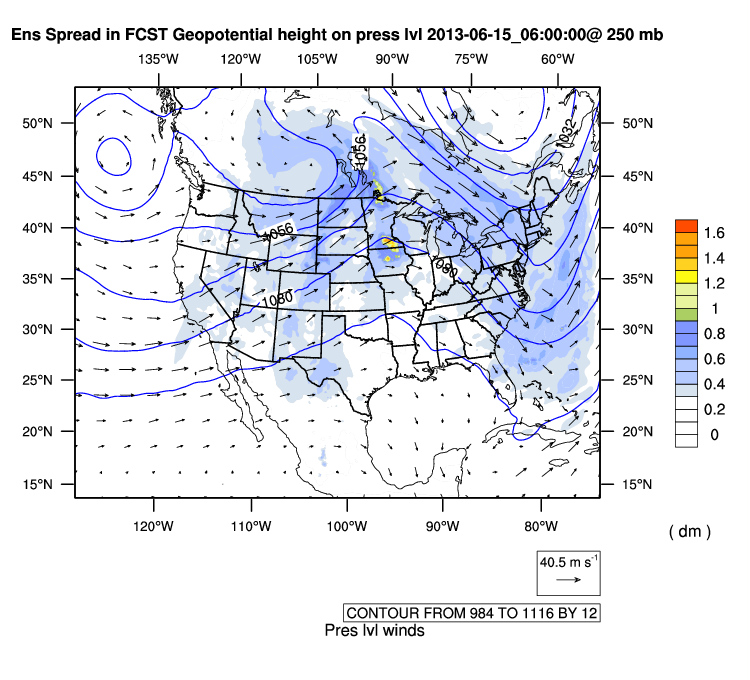
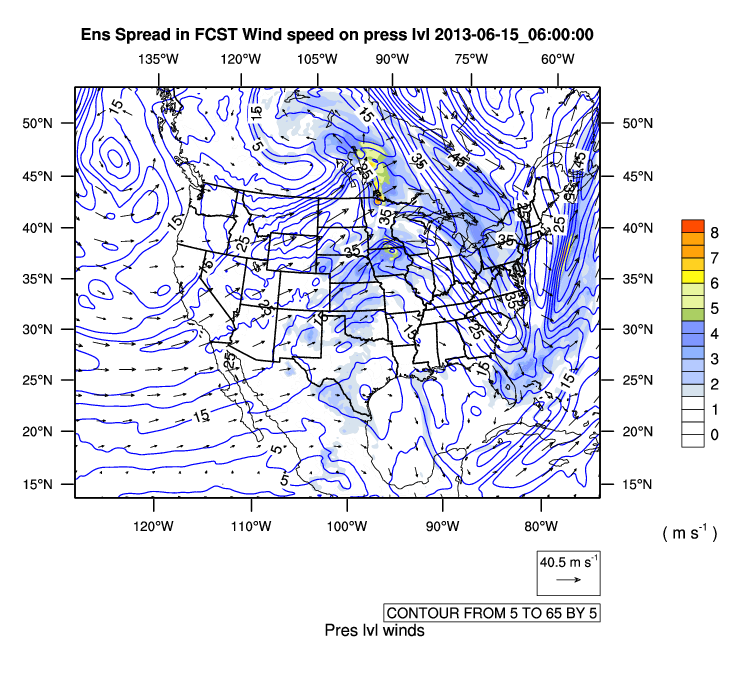
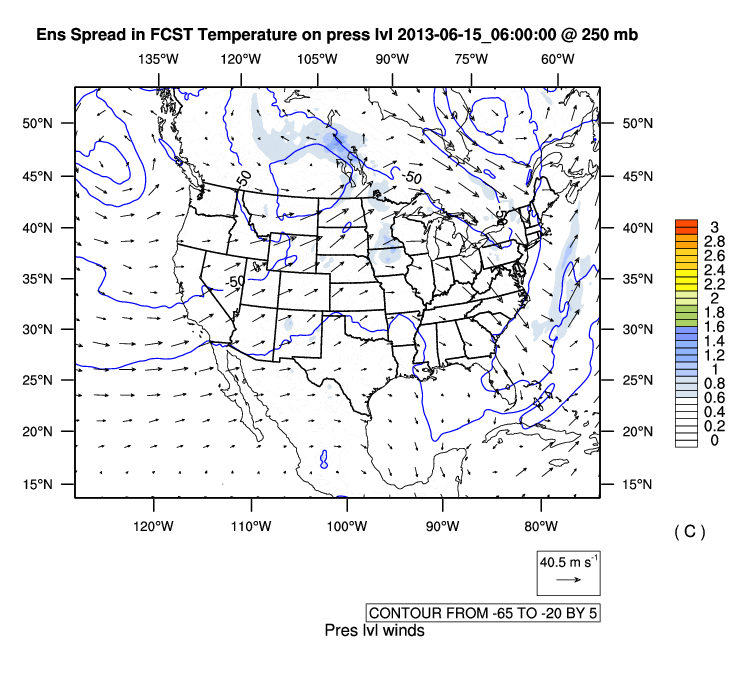
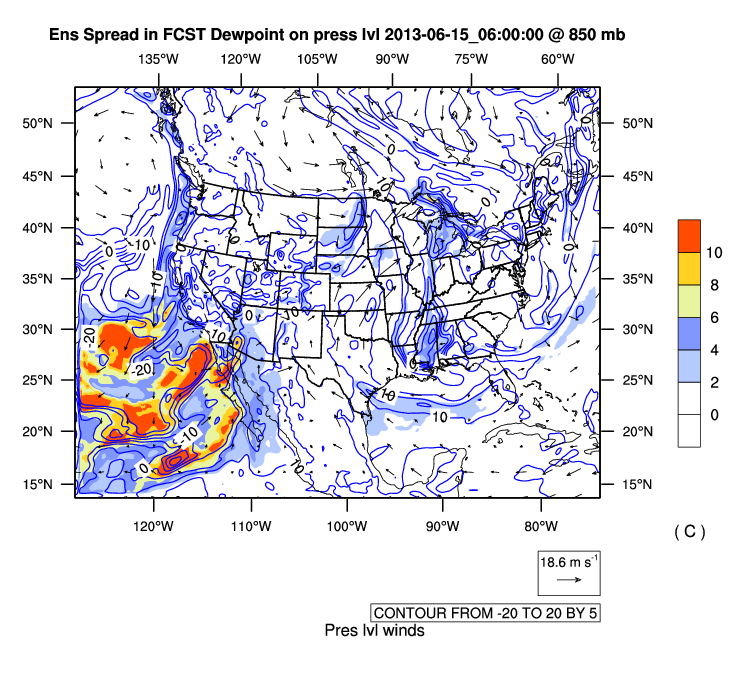
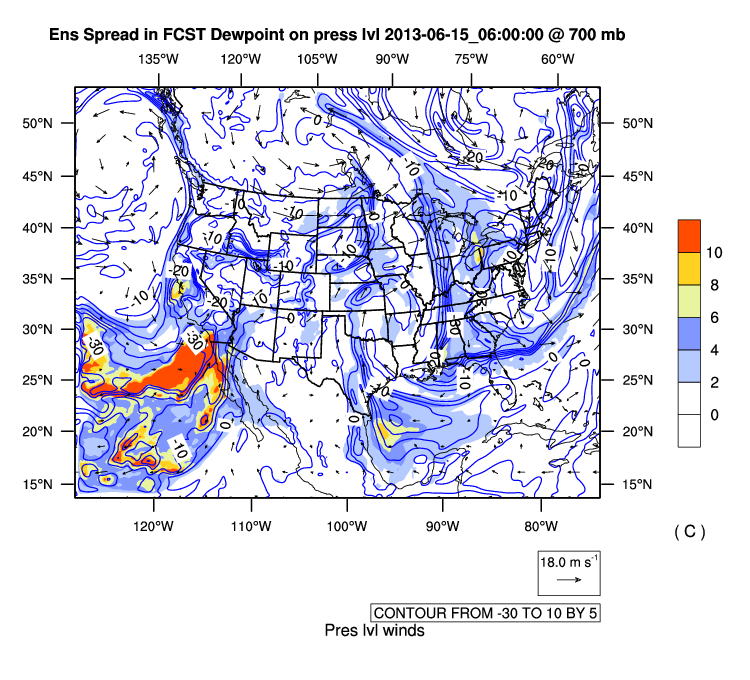
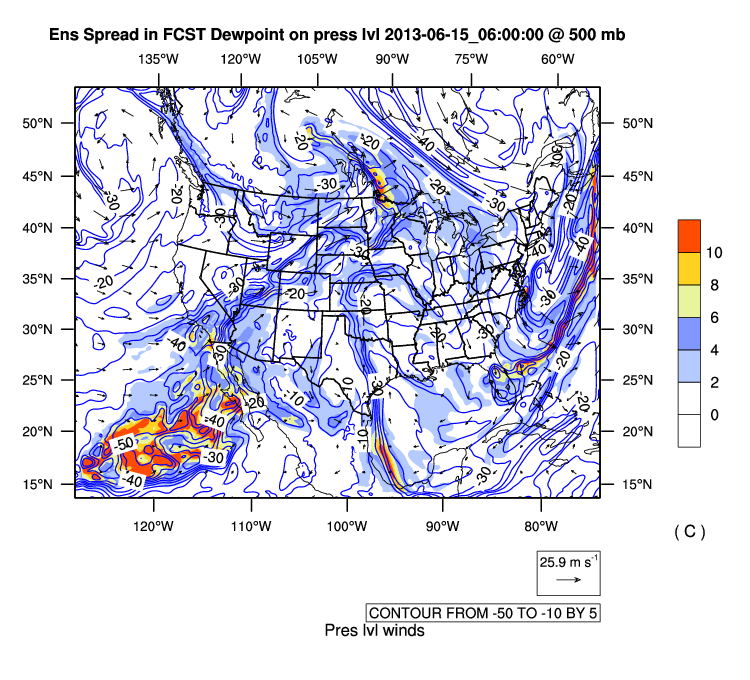
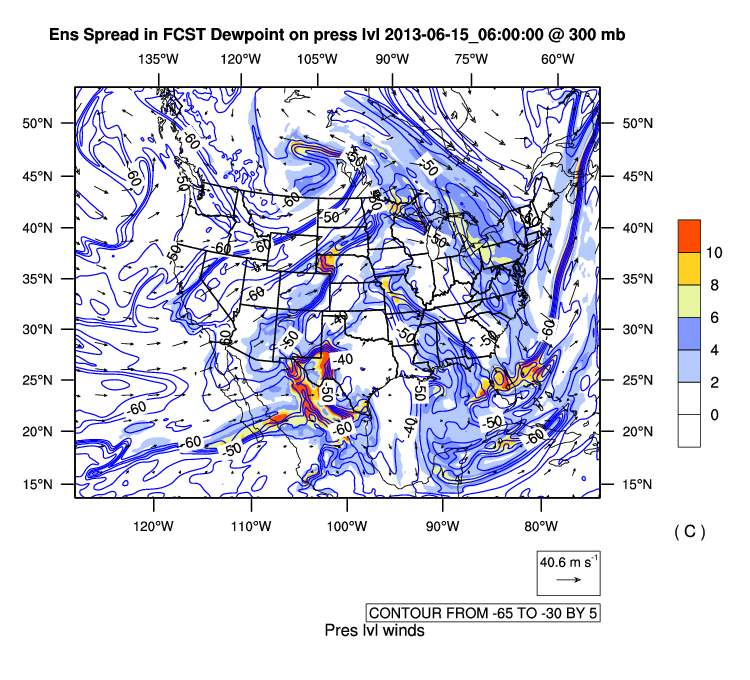
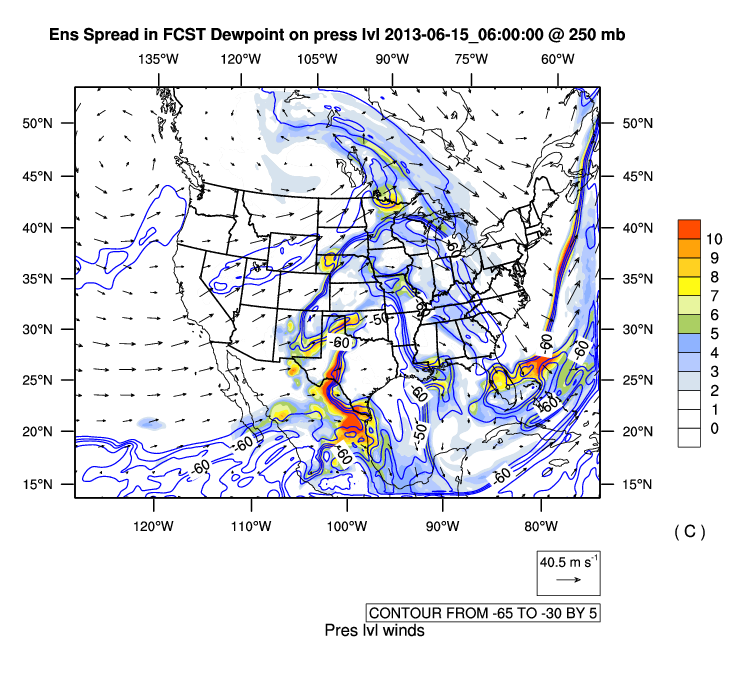
Ensemble Forecast (+6 hr) Spread
2M Temperature
2M Water Vapor
2M Dewpoint
Mean Sea Lvl Press
Precipitable Water
Sim. Reflectivity
ML CAPE
ML CIN
0-3km SRH
Fields on constant pressure surfaces (mb):
Geopotential Height:
850
700
500
300
250
Isotachs:
850
700
500
300
250
Abs. Vorticity:
850
700
500
300
250
Temperature:
850
700
500
300
250
Dewpoint:
850
700
500
300
250
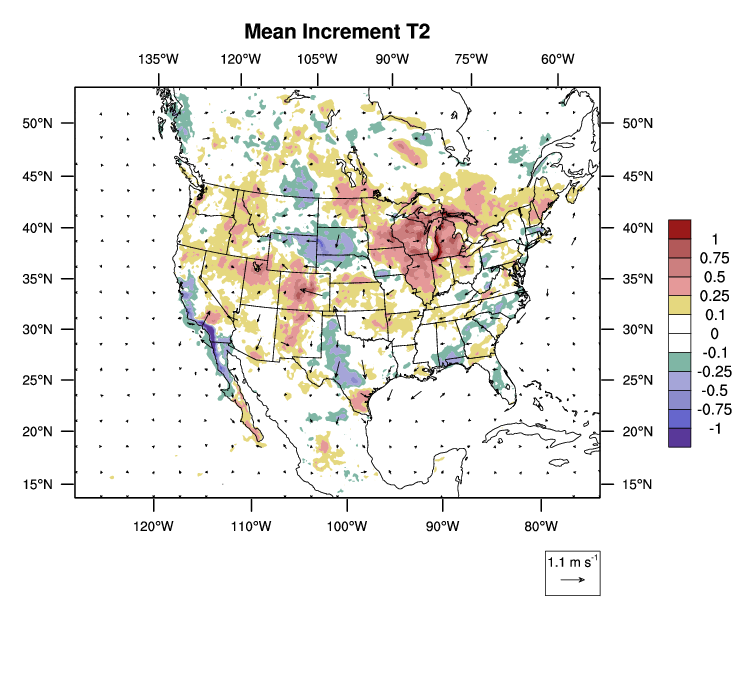
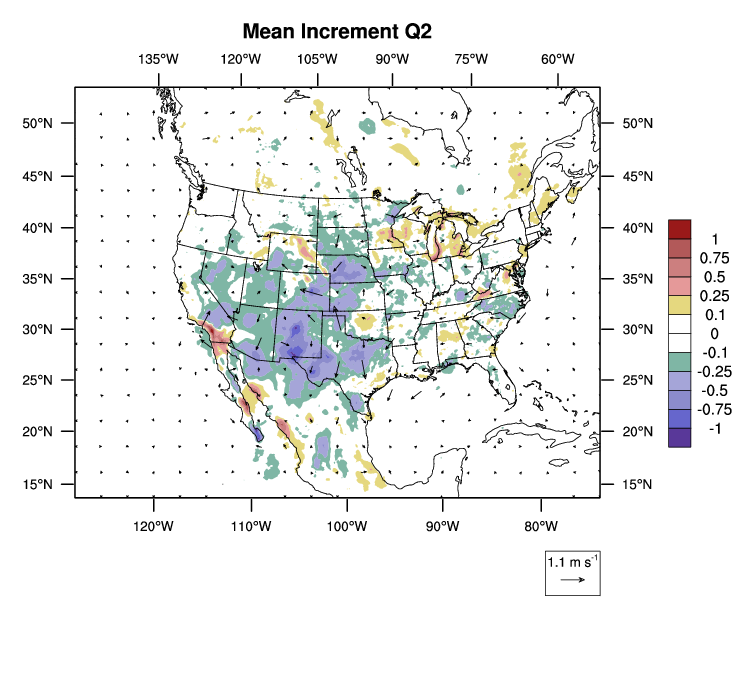
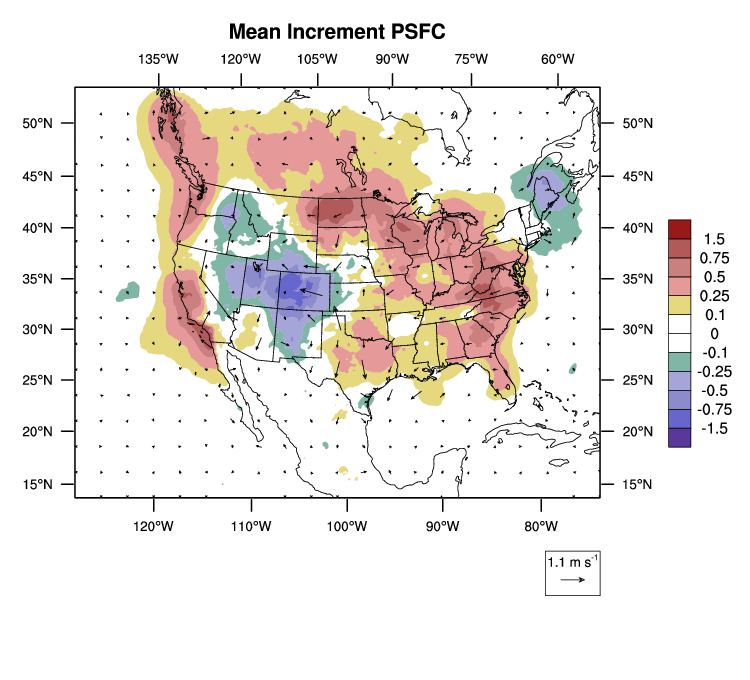
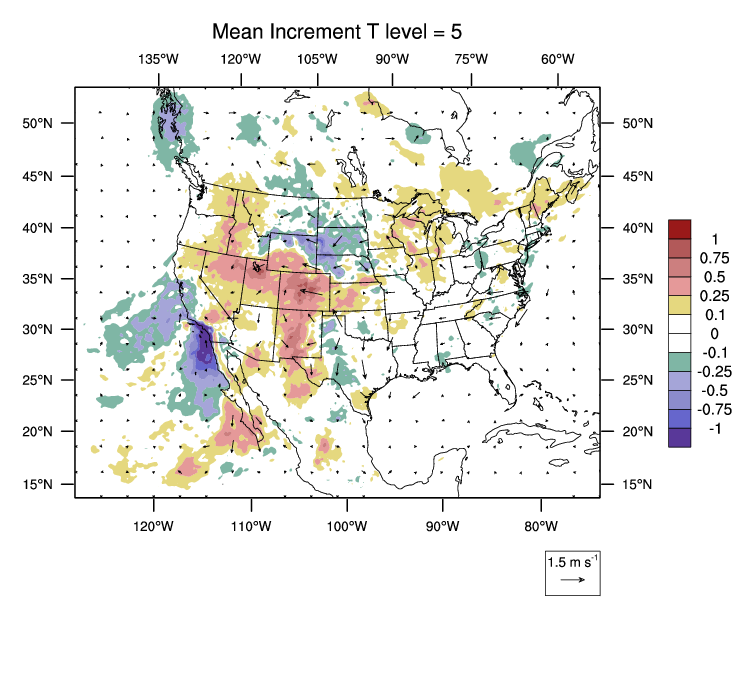
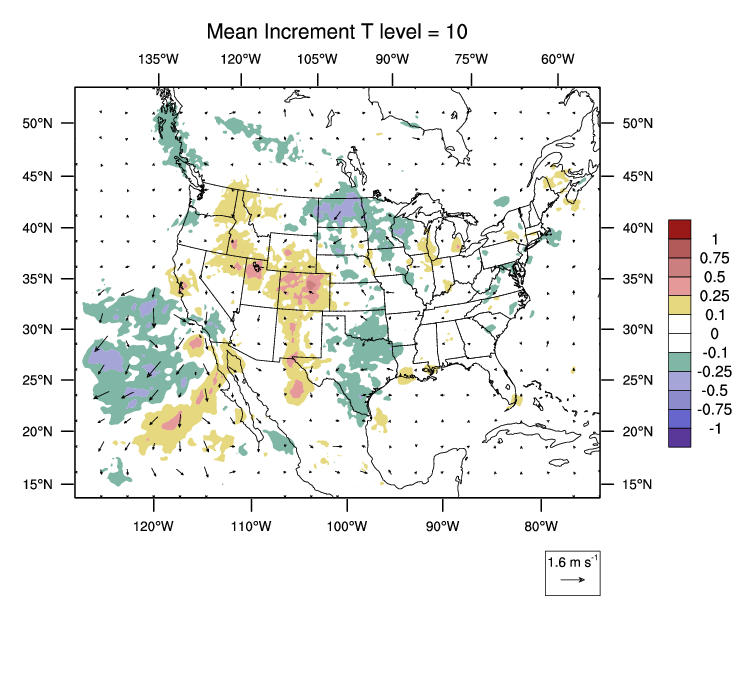
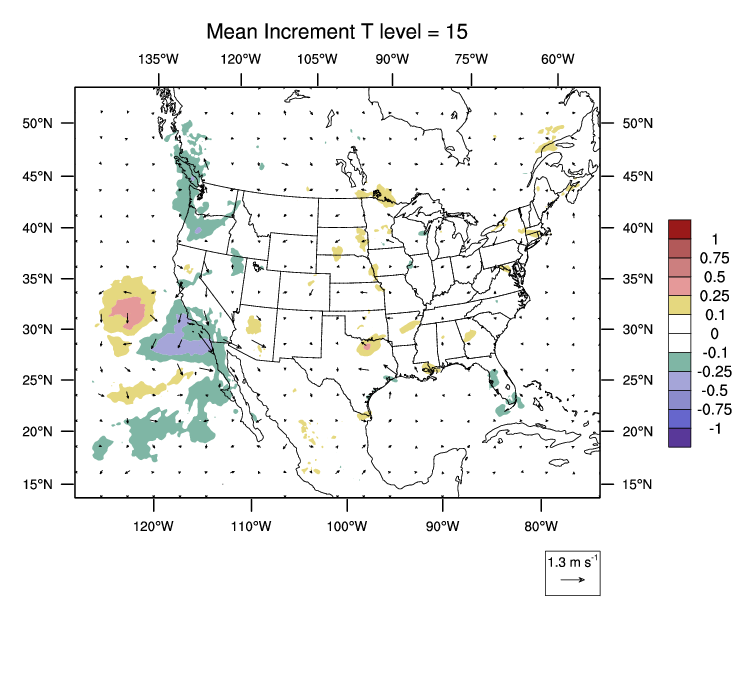
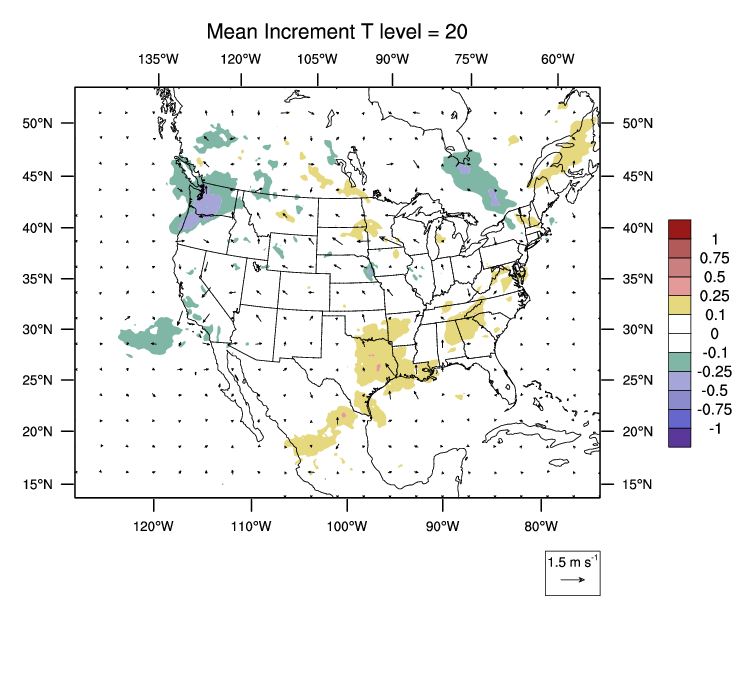
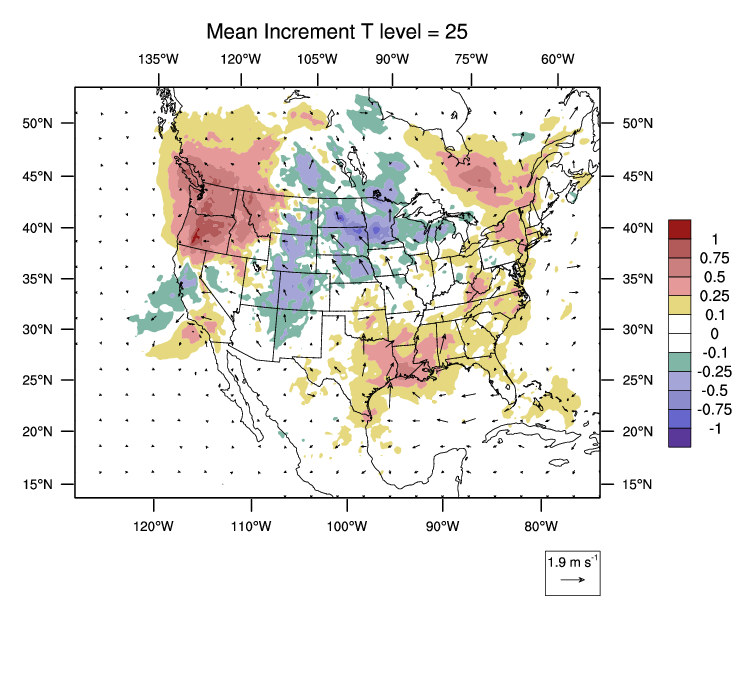
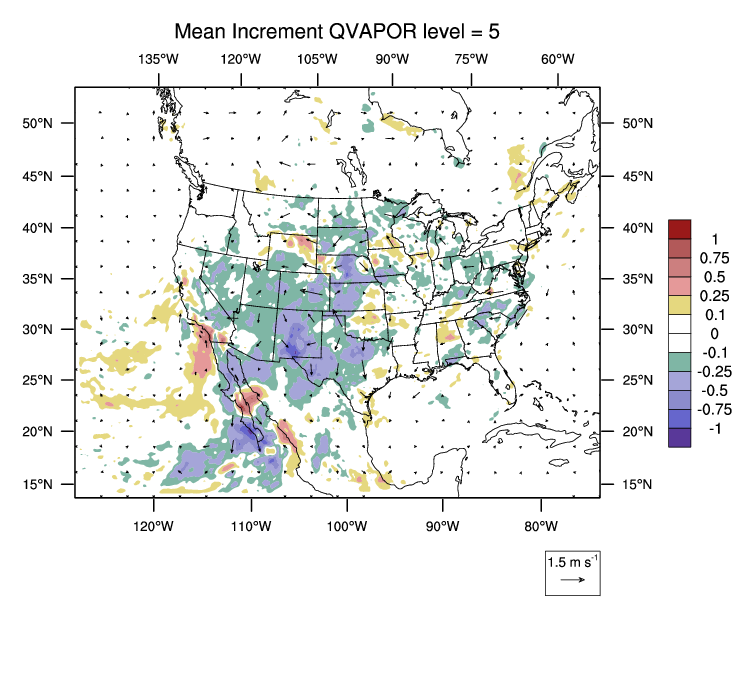
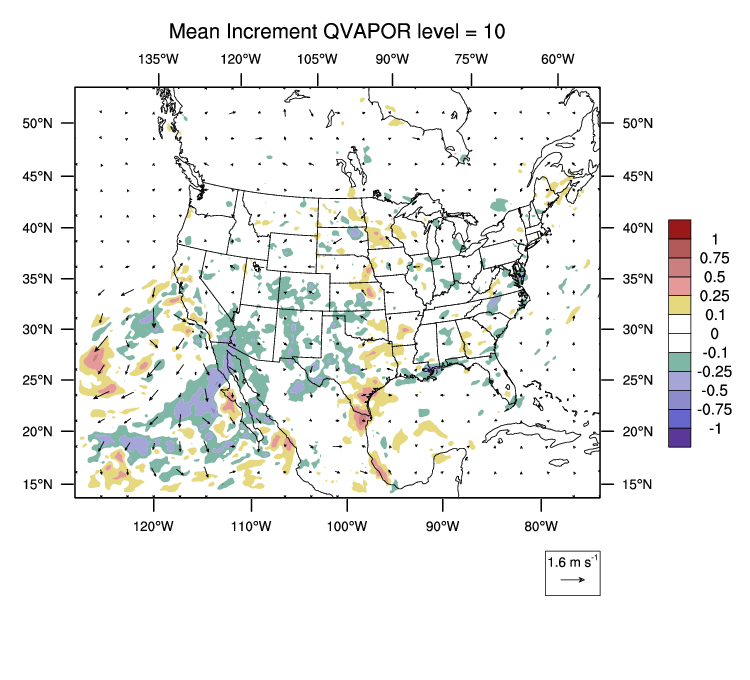
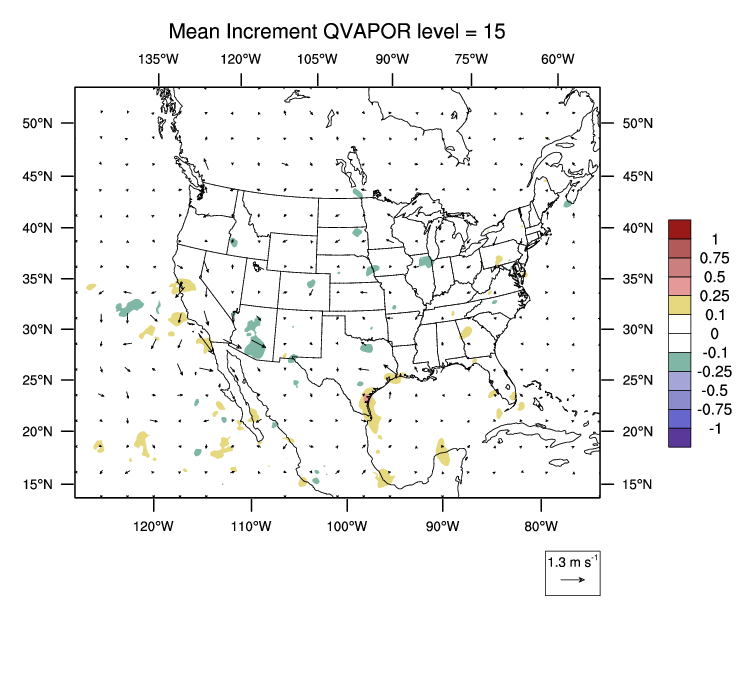
Mean analysis increment (last 7 days)
2M Temperature
2M Water Vapor
Mean Sea Lvl Press
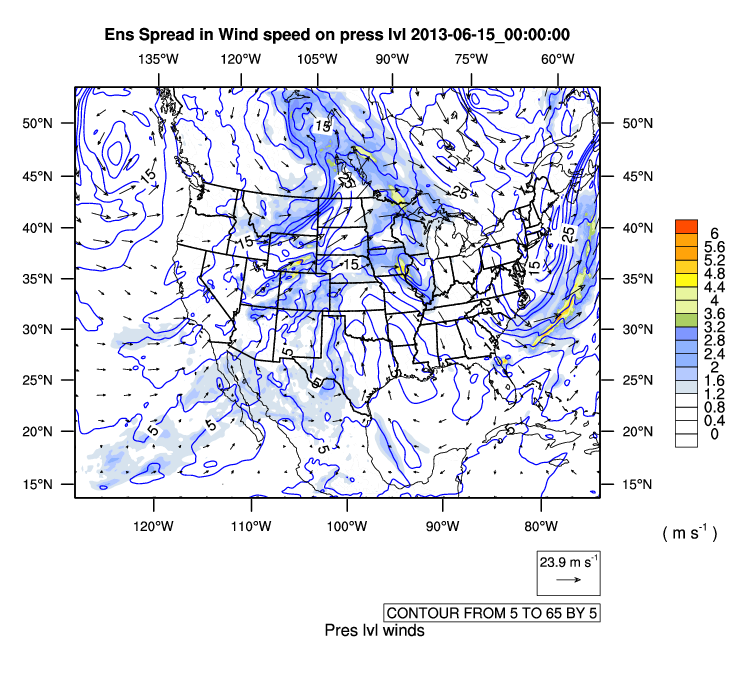
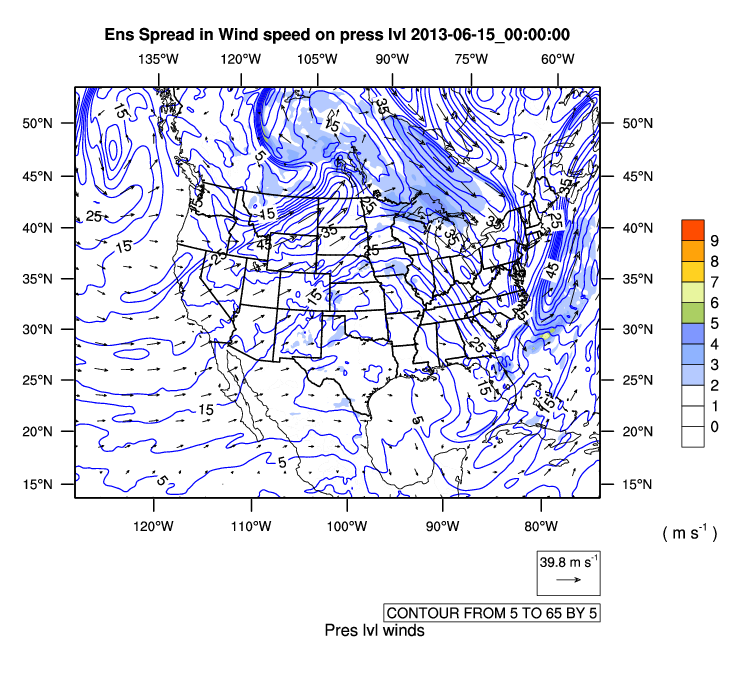
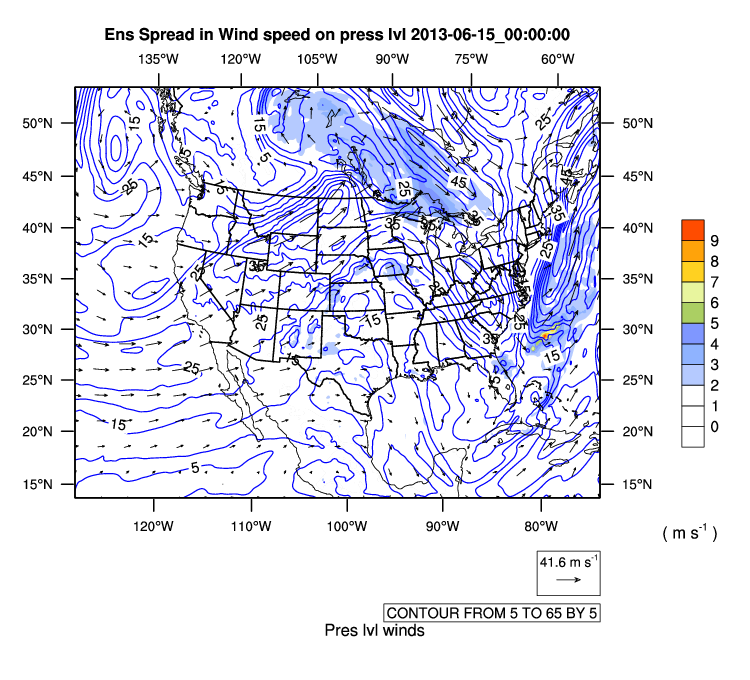
Fields on model levels:
Temperature + wind vectors:
5
10
15
20
25
Water vapor + wind vectors:
5
10
15
--
--
Return to
main index