 Edit the Network

|
edit.networkEdit an existing networkWe begin with help on the command line side and then present a demonstration of how to edit a network object using the GUI display dialog.Edit an existing network. DESCRIPTION: Edits an existing network that has already been plotted. USAGE: edit.network(nw.obj=new.network, tol=1.5) REQUIRED ARGUMENTS: nw.obj A network object usually created by make.network.obj OPTIONAL ARGUMENTS: tol How close to a point to delete the point. VALUE: Returns a network object with new location values and all other values the same. SIDE EFFECTS: Changes an existing plot, but does not change an existing image or contour. DETAILS: Once a network is plotted, edit.network allows the user to left-click on the plot wherever a new location point is desired. It also deletes points if an existing point is left-clicked. When the user hits the right mouse button the program exits. SEE ALSO: network.plotter, make.network.obj, make.cov.obj, plot.prob EXAMPLES: net <- make.network.obj( locs=example.locs, cov.obj=example.cov.obj ) network.plotter( nw.obj=net, add.image=F, add.contour=T ) new.net <- edit.network( net ) # user adds/deletes points to network by left clicking on plot. # To exit, user clicks on right mouse button. |
Edit the Network
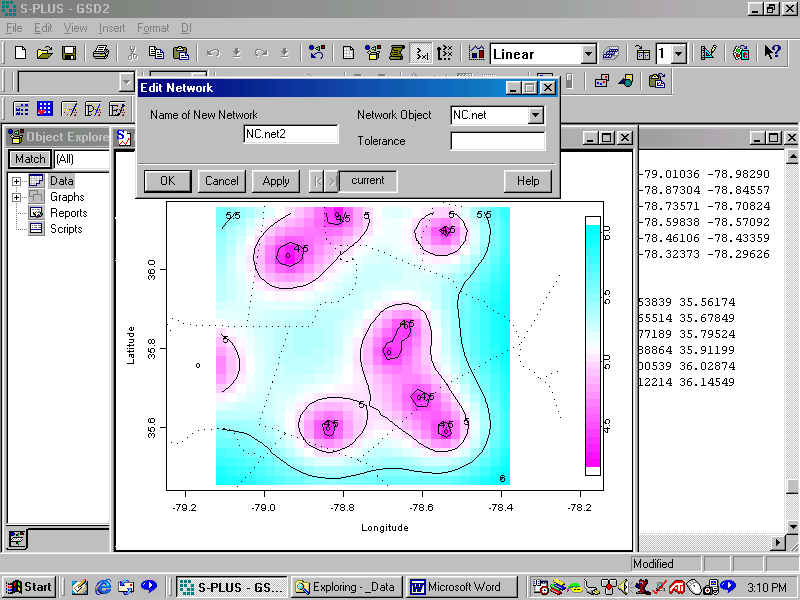
To edit the network, we must first plot the network using the third toolbar button; network.plotter. For this plot you may wish to use a less-involved plot than the one here, but since this data set is small, we will continue with all of the features.
Next, we click on the edit network toolbar button (fifth button) and we take care to move the edit network dialog off of the plot we just created or else it will cover parts of the graph and we will be unable to edit those parts.
Name of New Network
The first box is the name of the new network object you wish to create.
Note that edit network creates a new network object based entirely on
the old one except with a new set of locations. We will call the new
network object NC.net2
Network Object
We must select the network that we have just plotted from the drop-down
menu; in this case, NC.net from the Network Object drop-down menu.
Tolerance
The final option does not need to be used. It may be changed if there
is difficulty clicking on points to remove or add them.
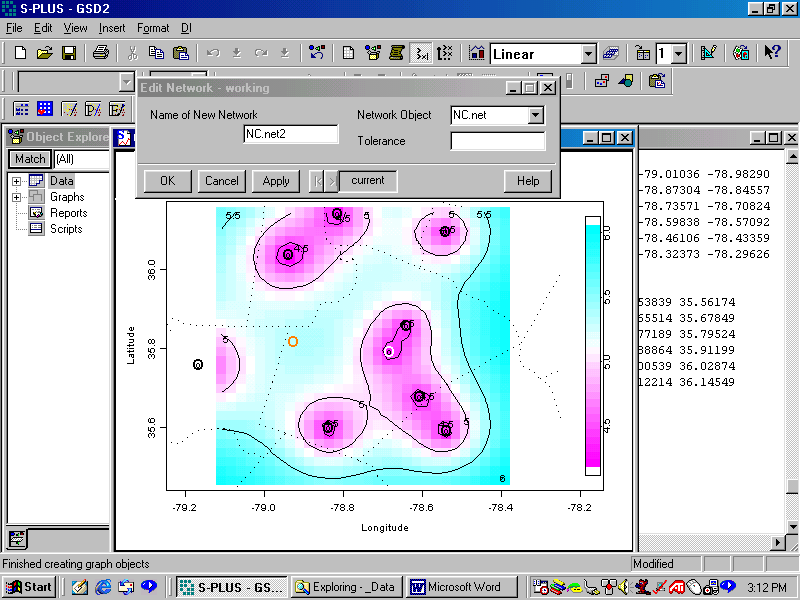
After pressing OK, we can add points by left clicking on a part of the graph that does not have an existing point. To delete a point, simply left click on the existing point. To exit the edit network function simply right click anywhere on the graph. The appearance of the graph will change after pressing OK on the edit network dialog. It will look more like the one below. Note that the orange circle represents a point that has been added to the network and the white circle represents a point that has been deleted from the network.
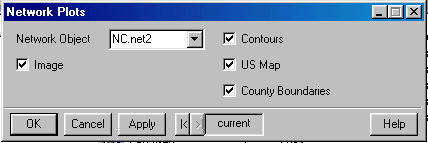
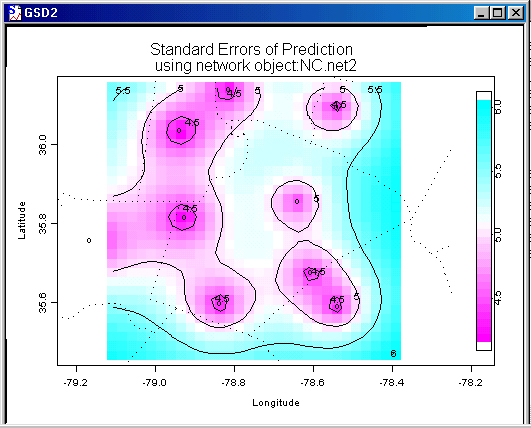
Once I have edited the network, I can plot the new network (along with the new standard errors of prediction if I choose) by clicking on the third toolbar button and selecting NC.net2 from the network object drop down menu. My new network plot looks like the one shown below.
This is software for statistical research and should not be used for commercial purposes. The authors do not guarantee the correctness of any function or program in this package.